Trending Assets
Top investors this month
Trending Assets
Top investors this month
@myweeklystock
My Weekly Stock
Stock and option trader. Weekly stock picking ideas and trading plans. Not financial advice
70 following27 followers
Earnings Week (April 18) 1-day price action
We are up for another busy week of earnings! Here are the reports I will look into and how the stocks performed historically, 1 day after the earnings release.
​
My favorite earning plays this week are $JNJ $PG and $DHR. $SNAP is a good "lottery" play for the more courageous among us!
I will definitively avoid $TSLA and $NFLX on earning day.
​
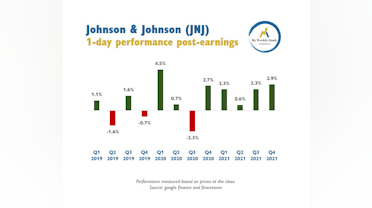
Jonhson & Johnson $JNJ - April 19 before the open.
1-day performance in the past 12 quarters:
  • Average returns = +1.2% 🟒
  • Average price move = + / - 1.9%
  • % of positive returns = 75% 🟒
​

​
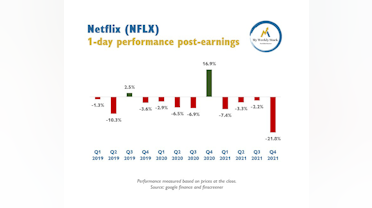
Netflix $NFLX - April 19 after the close
1-day performance in the past 12 quarters:
  • Average returns = -3.9% πŸ”΄
  • Average price move = + / - 7.1% ⚠️
  • % of positive returns = 17% πŸ”΄
​

​
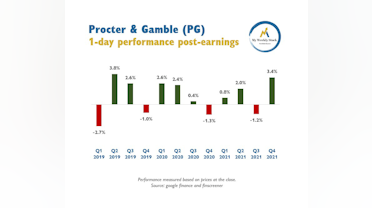
Procter & Gamble $PG - April 20 before the open
1-day performance in the past 12 quarters:
  • Average returns = +1.0% 🟒
  • Average price move = + / - 2.0%
  • % of positive returns = 67% 🟒
​

​
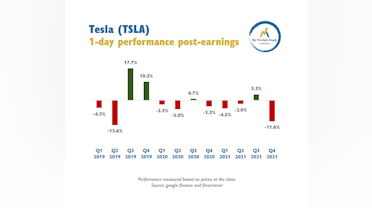
Tesla $TSLA - April 20 after the close
1-day performance in the past 12 quarters:
  • Average returns = -1.2% πŸ”΄
  • Average price move = + / - 6.5% ⚠️
  • % of positive returns = 33% πŸ”΄
​

​
United Airlines $UAL - April 20 after the close
1-day performance in the past 12 quarters:
  • Average returns = -2.3% πŸ”΄
  • Average price move = + / - 4.2%
  • % of positive returns = 33% πŸ”΄
​

​
Danaher $DHR - on April 21 before the open
1-day performance in the past 12 quarters:
  • Average returns = +1.6% 🟒
  • Average price move = + / - 2.1%
  • % of positive returns = 75% 🟒
​

​
American Airlines $AAL - April 21 before the open
1-day performance in the past 12 quarters:
  • Average returns = +0.3% 🟒
  • Average price move = + / - 4.2%
  • % of positive returns = 50% 🟒
​

​
$SNAP - April 21 after the close
1-day performance in the past 12 quarters:
  • Average returns = +10.3% 🟒
  • Average price move = + / - 20% ⚠️ 🎒 ⚠️
  • % of positive returns = 58% 🟒
​
οΏΌ
post mediapost mediapost mediapost media

Stocks patterns post Earnings - Week April 11th
The earnings season starts this week! Here are the reports I will look into and how the stocks performed historically, 1 day after the earnings release.

My favorite earning plays this week are $MS and $BLK.

JP Morgan $JPM - April 13th before the open
1-day performance in the past 12 quarters:
  • Average returns = -0.6% πŸ”΄
  • Average price move = + / - 2.4%
  • % of positive returns = 42% πŸ”΄

Blackrock $BLK - April 13th before the open
1-day performance in the past 12 quarters:
  • Average returns = +1.2% 🟒
  • Average price move = + / - 2.9%
  • % of positive returns = 67% 🟒

Delta Air Lines $DAL - Apr 13th before the open
1-day performance in the past 12 quarters:
  • Average returns = -0.8% πŸ”΄
  • Average price move = + / - 2.5%
  • % of positive returns = 42% πŸ”΄

Fastenal $FAST - April 13th before the open
1-day performance in the past 12 quarters:
  • Average returns = +1.4% 🟒
  • Average price move = + / - 4.0%
  • % of positive returns = 42% πŸ”΄

Bed Bath & Beyond $BBBY - Apr 13th before the open
1-day performance in the past 12 quarters:
  • Average returns = -3.0%πŸ”΄
  • Average price move = +/- 14%⚠️
  • % of positive returns = 42%πŸ”΄

Morgan Stanley $MS - April 14th before the open
1-day performance in the past 12 quarters:
  • Average returns = +1.5% 🟒
  • Average price move = + / - 2.0%
  • % of positive returns = 75% 🟒

Goldman Sachs $GS - April 14th before the open
1-day performance in the past 12 quarters:
  • Average returns = -0.4% πŸ”΄
  • Average price move = + / - 2.0%
  • % of positive returns = 58% 🟒

United Health $UNH - April 14th before the open
1-day performance in the past 12 quarters:
  • Average returns = +1.1% 🟒
  • Average price move = + / - 3.0%
  • % of positive returns = 58% 🟒

Wells Fargo $WFC - April 14th before the open
1-day performance in the past 12 quarters:
  • Average returns = -1.7% πŸ”΄
  • Average price move = + / - 4%
  • % of positive returns = 33% πŸ”΄

Citigroup $C - April 14th before the open
1-day performance in the past 12 quarters:
  • Average returns = -1.6% πŸ”΄
  • Average price move = + / - 2.3%
  • % of positive returns = 25% πŸ”΄
post mediapost mediapost mediapost media

Weekly Debrief Mar. 25 - Apr. 1
The equity markets were flat for the week, with the SP500 finishing up 0.1% and the NASDAQ +0.7%. The stock indices were due for a pause after the rally since mid-March.

The key yield curve finally inverted this week (10-year rate lower than the 2-year), which historically has been a signal of a future economic recession. However, the recession's timing and its impact on the stock market are not easy to predict.

Oil dropped below $100 after the US released more barrels from its strategic reserve.

We saw a mixed sector performance, with 7 out of the 11 SP500 sectors positive this week. Real Estate and Utilities led the market while Energy and Financials lagged.

Energy remains the undisputable winner of 2022 with a 39% gain, while Utilities Is the only other positive sector this year, and Communication Services is the only remaining sector in correction territory.

More charts in my weekly stock debrief:

post mediapost media
myweeklystock.substack.com
My Weekly Stock Debrief - Mar 25 - Apr 1
Dear subscribers, Welcome to My Weekly Stock’s debrief for week #13 of 2022 (Mar 25-Apr 1st), our weekly newsletter reviewing the market performance this week in 10 points: Marker Performance SP500 Sector Performance

Stocks patterns post Earnings - Week March 28th
The earnings season for this quarter is close to an end. Here are the reports I will look into this "light" week and how the stocks performed historically 1 day after the earnings release. My favorite earning plays this week are $MU and $BNTX

If you find these charts useful, let me know which stocks would you be like to see for next week!

Micron Technology ($MU) - Mar 29th after the close
1-day performance in the past 12 quarters:
  • Average returns = +2.0% 🟒
  • Average price move = + / - 7%
  • % of positive returns = 58% 🟒

Lululemon $LULU - Mar 29th after the close
1-day performance in the past 12 quarters:
  • Average returns = +0.5% 🟒
  • Average price move = + / - 6%
  • % of positive returns = 42% πŸ”΄

Chewy $CHWY - Mar 29th after the close
1-day performance in the past 12 quarters:
  • Average returns = -4.4% πŸ”΄
  • Average price move = + / - 6%
  • % of positive returns = 18% πŸ”΄

BioNTech $BNTX Mar 30th before the open.
1-day performance in the past 9 quarters:
  • Average returns = +2.5% 🟒
  • Average price move = + / - 7%
  • % of positive returns = 56% 🟒

Walgreens $WBA - Mar 31st before the open.
1-day performance in the past 12 quarters:
  • Average returns = -1.4% πŸ”΄
  • Average price move = + / - 6%
  • % of positive returns = 50%

post mediapost mediapost mediapost media

GameStop Earnings - Stock pattern
$GME reports its quarterly earnings today after the close.

1-day performance in the past 12 quarters:
Average returns = -14.6% πŸ”΄
Average price move = + / - 15% ⚠️
% of positive returns = 17% πŸ”΄


οΏΌ

$GME has been such a wild ride. I don’t think they have the grit to make the right moves to justify the price spike over the pandemic. What do you think?
+ 1 comment
My Trading Approach
Swing trades focused on Mega-Cap Stocks and Options
  • I make only one trade per week. I buy at the open on Monday and sell at the close on Friday (or before, more later about stop-loss).

  • I focus on US mega-cap stocks, with a market capitalization higher than $150bn.

  • I trade exclusively call options. I select short-dated, in-the-money options with an expiration date of one week and a strike price 7 to 15% below the current stock price.

A momentum strategy based on a proprietary algorithm
  • I collect various momentum and technical indicators for each stock in my stock universe (US mega-caps): Moving averages, RSI, MACD, stock performance, 52w High / Low.
  • I perform a comparative ranking to find the best momentum stock among the specific group.
  • I then assess the confidence level by looking at the absolute momentum for the weekly pick and the market overall. It is then compared to historical data since 2019 to evaluate the likelihood of success.

Optimized trading plan for maximized gains and manageable losses:
  • I primarily use the confidence level to define the leverage and the size of my position.
  • To preserve my capital and lock my gains: I withdraw all my profits weekly and never add more funds to my trading account.
  • I usually exit my trade if the stock is down 2% or up 6% vs. the Monday open.

My options trading performance in 2022 is up 218% after 10 weeks. Even without leverage, the strategy generates sizeable returns in absolute and relative to the SP500. My Weekly Stock's picks delivered a cumulative return of 400%, 5x the performance of the SP500 since 2019.

I can't link my brokerage account to Commonstock as I am not based in the US but all my trades are shared timely on substack.

Read more about my trading approach on the link below:


You can see below what I have traded in 2022 and my weekly returns. As I follow a momentum strategy and Energy is the best sector in 2022, no surprise that I mostly traded oil stocks:
post media
myweeklystock.substack.com
My Weekly Stock - Trading Strategy
Dear subscribers, You will below more details about my trading strategy. I initiated my research in 2019 and spent the following two years collecting data, refining my algorithm, and paper-trading my stock picks. In 2021, I felt confident enough to put in actual money. After a very successful year, I have decided in January 2022 to publish my stock picks.

#options indeed! Very impressive! How did you build your system? It seems well thought out! For those interested in options, how would you recommend to get started?
+ 1 comment
Oracle earnings - stock pattern
$ORCL reports its quarterly #earnings today after the close.
1-day performance in the past 12 quarters:
Average returns = +1.5% 🟒
Average price move = + / - 6%
% of positive returns = 42% πŸ”΄

$SPY $QQQ
post media

Crowdstrike earnings - Stock pattern
$CRWD reports its quarterly #earnings today after the close.
1-day performance in the past 11 quarters:
Average returns = +2.6% 🟒
Average price move = + / - 8.7%
% of positive returns = 55% 🟒

​
​
οΏΌ
post media

Broadcom post-earnings stock pattern
$AVGO reports its quarterly #earnings today after the close.
1-day performance in the past 12 quarters:
Average returns = +1.7% 🟒
Average price move = + / - 4.0%
% of positive returns = 67% 🟒

post media

Costco Post-earnings stock patters
$COST reports its quarterly #earnings today after the close.
1-day performance in the past 12 quarters:
Average returns = +0.6% 🟒
Average price move = + / - 2.0%
% of positive returns = 42% πŸ”΄

post media

Watchlist
Something went wrong while loading your statistics.
Please try again later.
Already have an account?