Introduction
$NVDA is one of the most pioneered companies in the semiconductor industry and particularly in the creation of AI chips. NVIDIA pioneered accelerated computing to help solve the most challenging computational problems. Since their original focus on PC graphics, they have expanded to several other large and important
computationally intensive fields. Fueled by the sustained demand for exceptional 3D graphics and the scale of the gaming market, NVIDIA has leveraged its GPU architecture to create platforms for scientific computing, artificial intelligence, or AI, data science, autonomous vehicles, or AV, robotics, metaverse, and 3D internet applications.
They report business results in two segments. The Compute & Networking segment which includes Data Center accelerated computing platform; networking; automotive AI Cockpit, autonomous driving development agreements, and autonomous vehicle solutions; electric vehicle computing platforms; Jetson for robotics and other embedded platforms; NVIDIA AI Enterprise and other software; and cryptocurrency mining processors, or CMP. The Graphics segment includes GeForce GPUs for gaming and PCs, the GeForce NOW game streaming services and related infrastructure, and solutions for gaming platforms; Quadro/NVIDIA RTX GPUs for enterprise workstation graphics; virtual GPU, or vGPU, software for cloud-based visual and virtual computing; automotive platforms for infotainment systems; and Omniverse Enterprise software for building and operating metaverse and 3D internet applications.
Operating Market
The company is specialized in markets in which computing platforms can provide tremendous acceleration for applications. These platforms incorporate processors,
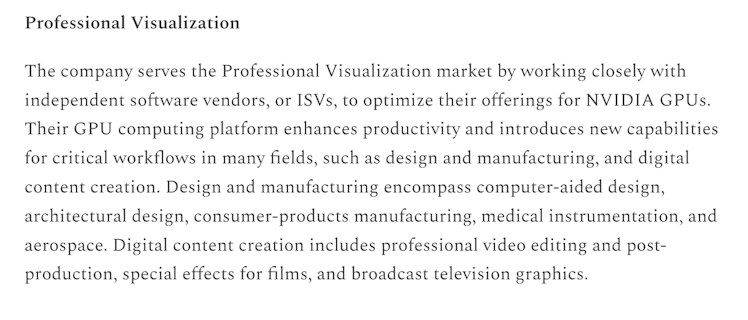
interconnects, software, algorithms, systems, and services to deliver unique value. Their platforms address four large markets where their expertise is critical: Data Centers, Gaming, Professional Visualization, and Automotive.
Revenues and Profitability Metrics
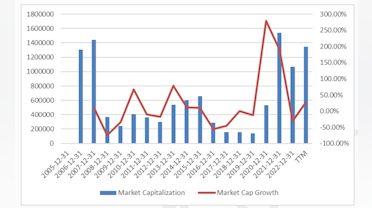
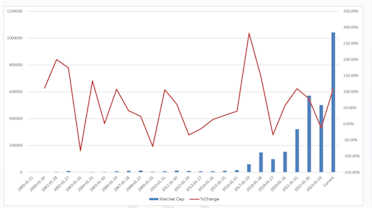
First, we are looking at the market cap and %change, to gain a first view of what we are going to purchase. As we can see, NVIDIA has gained a record high in market cap and has become a 1 trillion dollar company. Furthermore, was too volatile especially during the dot.com bubble (2001), during the global crisis (2008), during the period of high demand for Bitcoin mining (2016-2017), and now for AI chips.
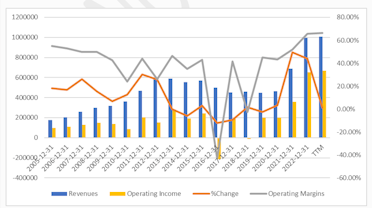
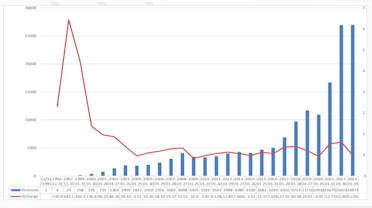
Looking at the whole revenues we can see that from 2000 through 2008 NVIDIA has an increase in revenues but after and till 2016 was almost stagnated. In 2016-2017 it is clear that they started to take advantage of the increasing demand for Data centers (cloud computing) with AI chips and at the same time they reported
high revenues from the high demand of GPU for Bitcoin mining. From 2017 till today, NVIDIA has been transformed from graphic chip processors to AI chip
processors for every possible workload.
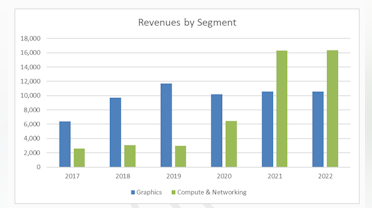
As a result and looking at the table below, it is clear that the graphic segment, which was in high growth in the previous years, now seems to have stagnated because NVIDIA has shifted its interest in AI chips for Data centers and Automotive. As a result, I will assume that the Graphics (Gaming and professional
visualization) segment has reached a mature growth phase, and the Data Center with Automotive is in a high growth phase.
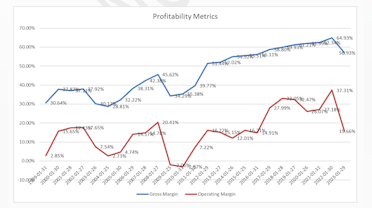
Since we spoke about revenues now we will examine the profitability of the company during all these years.
As we mentioned before, NVIDIA is a company that is very sensitive to macro events and operating profits has depicted that fact. Between 2000 and 2010, operating margins had the highest value at 20% (2007-2008), which is close to the median of the third percentile for the semiconductor sector and the lowest was in 2009-2010 after the global crisis with value -2%. After that, the profitability of the company increased with a peak in 2021-2022 and an operating margin of 37%. Last year, as a consequence of high inflation, the company announced stable revenues with operating margins of 20%.
As a high-tech company in hardware, R&D expenses were too high because they wanted to innovate, firstly as a graphic processor company and then gradually started to take advantage of the crypto space and now as an AI chips company for Data centers and Automotive. Since accountants handle R&D as expenses, it is very logical for companies like NVIDIA to report lower operating margins than the true ones, and I will capitalize R&D expenses because the company gains high future value from them. As a result, the average (2000-TTM) operating margin of 16% becomes 38%, and during the last 3 years from 25% to 49%.
NVIDIA Narrative
Every valuation starts with a narrative, a story that you see unfolding for your company in the future. In developing this narrative, I will try to make assessments
for the company (its products, services, and management), the market, the competition, and the macro environment in which operates trying to:
- Keep it simple.
- Keep it focused.
- Stay grounded in reality.
NVIDIA is a company in a mature growth phase because its IPO date was in 1999. Regardless of its phase, I will treat the Data center and Automotive segment as being in high growth because of the potential of AI chips and the Graphic segment as being in a Mature growth phase.
- Leading company in AI chips with a market share worldwide equal to 80% (Current) but gradually, because of the high competitive advantage will be reduced to 50%.
- Leading company in the Automotive market with a market share of 3% (Current) and will expand at 30%.
- In profitability, I will give my best shoot and I will use the adjusted operating margin during the last 7 years equal to 50%.
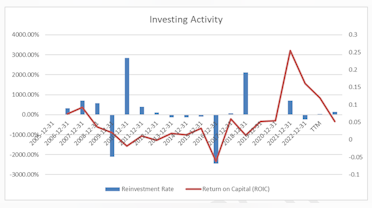
- Reinvestment Rate: Median of the Semiconductor sector because of high efficiency.
Below you will find my final valuation with my narrative and assumptions:
Monte Carlo Simulation and Scenario Analysis
The reasons that I use a Monte Carlo simulation are the following:
- Many reports revealed different values for the Total AI chips.
- NVIDIA market share cannot be predicted, as a point estimation, because there are not enough data to help us.
- To view where my valuation stands and what is the market view about the company.
Results from the simulation:
What Market Believes about the Value of NVIDIA can be found to the table below:
Conclusion
A good valuation stands between the numbers and narratives. I tried to make estimations in fundamental factors, looking at the history of the company and then I adjusted them to reflect the high competition and the macroeconomic effects. Furthermore, I ran a Monte Carlo simulation to watch where my valuation stands relative to the market view. Taking into account the above table I believe that the assumptions that the market has done are impossible to happen and that’s why, not only believe that is overvalued but also has reached irrational levels.
The main advantage of NVIDIA is that has early entry in AI chips and leads the way in the Global market. Due to the high growth of the sector, it is avoidable the
high competition from other companies like Intel, Qualcomm, Tesla, Xilinx, Apple, and AMD and that’s why I assumed that the market share of AI will reduce during
the decade. Also in my narrative, I assumed high growth with a medium reinvestment rate (relative to the semiconductor sector) and at the same time high competitive advantage for perpetuity. As a result, I gave my best shot to my valuation and I couldn’t even touch the market price. To conclude, for my taste NVIDIA is overvalued and I will not pay the price that the market offers me. I hope all of you have good investments and thank you for supporting my work.