Trending Assets
Top investors this month
Trending Assets
Top investors this month
@richardmoglen
Richard Moglen
$20.6M follower assets
Stock Trader working hard to manage risk and concentrate on the True Market Leaders
31 following393 followers
I just released an interview with @jasonathomson, Portfolio Manager at @oneilglobal

We discuss his process, how to analyze the market & individual companies, and combining Fundamental & Technical Analysis.

He talks about how he builds conviction, and fundamental red flags he watches for.

YouTube
The Keys of Successful Investing with O'Neil Portfolio Manager Jason Thomson
Welcome back to the Market Chat. Our guest today is Jason Thomson, portfolio manager at O'Neil Capital Management and O'Neil Global Advisors.In this intervie...

Book Recommendation: Secrets for Profiting in Bull and Bear Markets
To any investors looking to learn more about technical analysis I would highly recommend you give Stan Weinstein's book a read.

Here's a video from Dr. Eric Wish, who has been investing and trading for 50 years, as he discusses Stage Analysis, Stan's method for determining the longer term trend of a stock.

YouTube
Protect Yourself from Bear Markets with Stage Analysis
📘 Get your FREE 115-page Ultimate Trading Guide: https://traderlion.com/YT-UTG🔍 Next-Generation Stock Screener: https://traderlion.com/YT-DV🦁 Follow us on...

Thanks for sharing Richard. I would say I am a real beginner at TA, is there a book you suggest I read before this ? or is this fairly jargon free and easy to follow ?
+ 2 comments
Advice for new traders from Jay Oliveira
Jay is a professional trader who first started in the 90s Bull Market as a broker. He is also a World Champion BJJ athlete.

Key Points
  • Study History and the Greatest Winning Stocks
  • Put in the Work
  • It takes time, be patient
  • Develop your own system.

YouTube
Do the WORK | Advice for New Traders
Jay Oliveira shares his advice for new traders for how to become profitable. Do the work, study winners, and develop your own strategy.Full Interview: https:...

5 Ways Weekly Charts can help your Trading & Investing
Weekly charts are a powerful timeframe, and regardless of your style, they can help you gain perspective on a particular setup and identify its potential

Using higher timeframes slows the action down and allows you to calmly analyze price and volume.

This will lead to better decision making.

For investors learning to analyze weekly charts and their trends can only complement your fundamental analysis.

For traders they are the "prevailing wind" and trading with this weekly trend will increase probabilities and help you remember to focus on larger patterns

  1. Weekly Charts show the True Trend of a Stock

Weekly charts eliminate a lot of the back and forth that occurs intraday and on daily charts. What is left is often a clear picture of the trend of a stock.

⬆️ Trending Up
↔️ Basing
⬇️ Trending Down

To identify this trend you are going to want to plot a 10 week SMA and a 30 week SMA on your charts

During a strong uptrend you will be amazed at how well the 10 week line acts as a guardrail for a stock's move

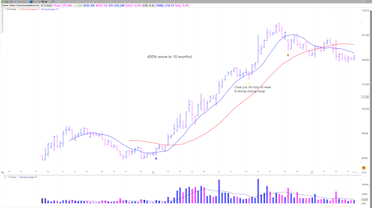
$ZM increased 450% in 10 months, undercutting the 10 week only once

This is not simply a 2020 occurrence. Most stocks which make significant moves > 100% show respect for the 10 week line.

This is because it is often a spot where institutions build/add to positions on pullbacks.

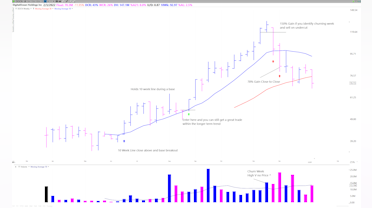
$DOCN advanced 150% in 6 months holding the 10 week sma

The same is true if you look back at the best performing stocks in history. The 10 week sma is consistently an area of support.

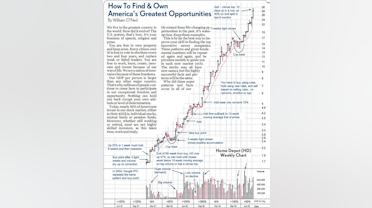
Here's is $HD's powerful move in 1981

The red line is the 10 week SMA.

The 30 week moving average is just as useful for investors and traders for identifying the stage of the stock

Stage 1 - Basing
Stage 2 - Advance
Stage 3 - Consolidation
Stage 4 - Distribution

The big money in made during S2 Uptrends and the big money is lost in S4 Declines

  • S1 - Price chops back & forth around a declining to flat 30 week MA
  • S2 - Starts with a big volume breakout from a base, Price starts trending above a rising 30 week MA
  • S3 - Price chops around a flattening 30 week ma
  • S4 - Price starts trending below a declining 30 week MA

Stage Analysis, developed by Stan Weinstein, shows the long term trend of any stock.

Both investors and traders should focus on stocks beginning or in Stage 2 Uptrends.

My Interview with Stan Weinstein: https://youtu.be/FtAshnE3MwM

  1. Weekly Charts reveal the footprints of Institutions.

Institutions can't hide when they begin and continue accumulating positions.

Look for.

✅ Huge Volume Spikes
✅ Tight Weekly Closes
✅ Increasing average weekly volume

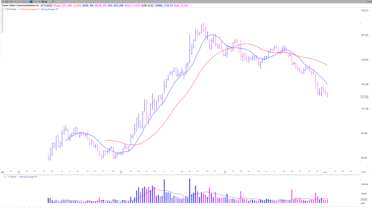
Look at the chart of $TSLA since 2019. Notice how breakouts from bases are accompanied by volume well above the 10 week average, & within bases volume dries up.

Look at significant volume weeks and determine based on context and CR if a stock is being accumulated or distributed

$SNAP is a great example of tight closes within a base suggesting institutions drew a line in the sand and were accumulating shares.

Also look for this after a breakout to see if institutions are still building positions

$FUTU is an example of weekly volume increasing during a move. As it does this the stock becomes more liquid and larger institutions can get involved.

  1. Focusing on Weekly charts reminds us that the biggest moves come from larger patterns.

100% + moves begin with a long basing period and a strong breakout.

Focus on 👇

✅ Recent IPOs after their first big base
✅ Mature names after they have consolidated

$NVDA has had multiple moves out of long basing patterns. This allows shares to fully transfer from short term players to longer term institutions

Recent IPOs often start long term moves out of their first primary base.

Read "The Lifecycle Trade" for more info 📘amzn.to/3n5epJR

  1. Weekly Charts Remove the Noise. Limit Decisions

As mentioned previously, weekly charts remove intraday and daily chop. The stock can move a lot throughout the week but it is the institutions who control where it closes.

The weekly action and trend supersedes the intraday and daily movements of a stock.

Always make sure you are stacking probabilities and trading with the weekly trend.
For investors, Weekly Charts are a great way to use technical analysis and time trades since there are a lot less signals to work with.

Position and even swing traders should also consider buying on a daily chart but then switching over to a weekly once the trend is established

This is especially helpful after a significant correction when trends can last a lot longer than we think and daily noise can scare us out.

Here's an example with $PTON buying on the daily and then managing the position on a weekly.

When the weekly trend changes PAY ATTENTION.

  1. Identify Key Levels and Pivots

Weekly chart highs and closes are excellent pivots to use on a daily chart for shorter term traders.

Inside weeks especially provide clear pivots for swing traders. These are volatility contractions on a lower timeframe.

Trading off weekly levels is a great way to improve the probability of a trade working since the weekly players are involved as well not just the daily and intraday traders.

I hope you all found this short article helpful!

If you did please Upvote, Repost, and reply with your thoughts

Also tag anyone else who you think would find it interesting. Take care!
post mediapost mediapost mediapost media

Great post Richard, I’ve moved a lot of my work to weekly charts now since reading Weinstein. It has given me a lot more mind space and clarity. I used to be engrossed in 5 and 15 min charts but now the lowest I’d go is a H1 and that would be rare. It’s all weekly and daily.

One question regarding the moving averages do you have any opinion on using 10EMA & 30EMA rather than Simple? I know it probably doesn’t matter overly but I find it hard to see a definitive thought on it.
+ 9 comments
"AMA: I am a trader who has interviewed Market Wizards, & Authors like Stan Weinstein & Jack Schwager

Wed, 11/24 @ 12:00pm EST
Hello everyone,

I’m excited to participate in Commonstock's 'ask me anything' series! On Wednesday, November 24th, at 12:00 PM Eastern Time, I will be hopping on to answer your questions for around an hour. Please ask your questions in the comments!

Educational Background & Professional Experience:

  • BS in Mechanical Engineering at the University of Maryland.
  • 2 years as a Teaching Assistant with Dr. Eric Wish for his class: Introduction to Technical Analysis and the Stock Market
  • Mechanical Engineer at the Naval Research Laboratory
  • Co-Founder of TraderLion - Trading Education Company
  • Host of the Market Chat Podcast with nearly 1 Million Views

Youtube

In 2019 I started my Youtube Channel which I've grown to over 42,000 subscribers. While many stock channels out there are more geared towards risky "quick money" and entertainment, my goal is to create a resource where people can learn a proven process with a focus on managing risk and long-term results.

A central part of my channel is my Market Chat Interviews, where I discuss with traders and investors their backgrounds, mindsets, and methodologies. I've interviewed US Investing Champions, Portfolio Managers, and Hedge Fund Managers who manage more than $500 Million.

Trading

I'm a pupil of the CANSLIM method, which is a process that pairs both technical and fundamental analysis. I use chart analysis to identify and manage shares in companies within overall strong themes and industries. I want to buy the fastest-growing companies with the greatest stories and ride their price trends for as long as they last.

Ask Me About
  • How to use charts even if you are an investor.
  • Technical Analysis misconceptions
  • How I use Python in finance
  • The CANSLIM methodology
  • Concentration vs. Diversification
  • The three most influential books that have changed the way I think
  • What I think about 'averaging down'
  • My favorite investing quotes
  • Risk Management
  • When to sell
YouTube
Richard Moglen
Helping teach financial literacy and technical analysis. You will learn how to grow your savings over time and successfully navigate the stock market. Videos are for educational purposes only. Always do your own research, use stop losses, and know your risks. Follow me on twitter here: https://twitter.com/RichardMoglen

Watchlist
Something went wrong while loading your statistics.
Please try again later.
Already have an account?