Trending Assets
Top investors this month
Trending Assets
Top investors this month
$20.6MFollowers
5 Ways Weekly Charts can help your Trading & Investing
Weekly charts are a powerful timeframe, and regardless of your style, they can help you gain perspective on a particular setup and identify its potential
Using higher timeframes slows the action down and allows you to calmly analyze price and volume.
This will lead to better decision making.
For investors learning to analyze weekly charts and their trends can only complement your fundamental analysis.
For traders they are the "prevailing wind" and trading with this weekly trend will increase probabilities and help you remember to focus on larger patterns
- Weekly Charts show the True Trend of a Stock
Weekly charts eliminate a lot of the back and forth that occurs intraday and on daily charts. What is left is often a clear picture of the trend of a stock.
⬆️ Trending Up
↔️ Basing
⬇️ Trending Down
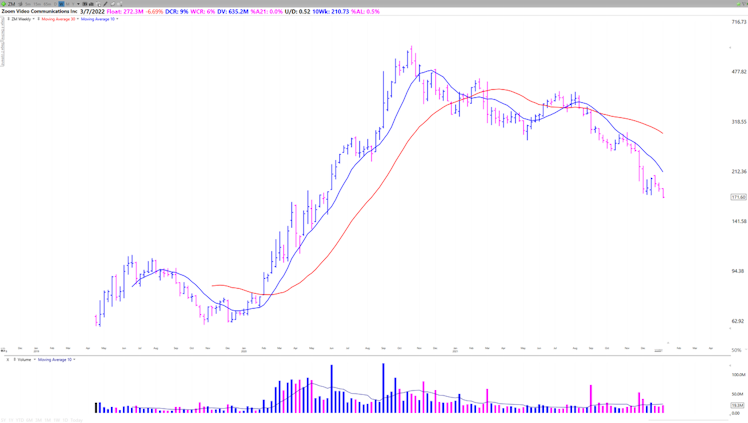
To identify this trend you are going to want to plot a 10 week SMA and a 30 week SMA on your charts
During a strong uptrend you will be amazed at how well the 10 week line acts as a guardrail for a stock's move
$ZM increased 450% in 10 months, undercutting the 10 week only once
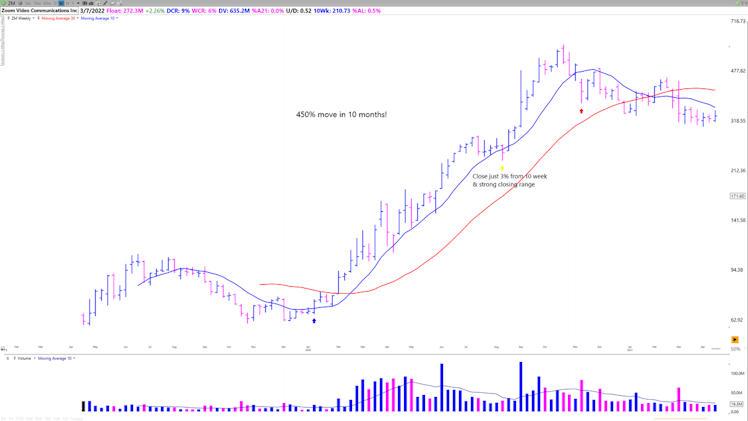
This is not simply a 2020 occurrence. Most stocks which make significant moves > 100% show respect for the 10 week line.
This is because it is often a spot where institutions build/add to positions on pullbacks.
$DOCN advanced 150% in 6 months holding the 10 week sma
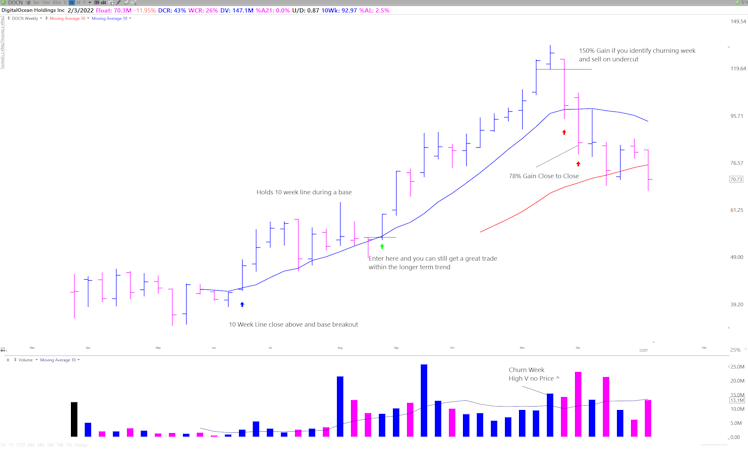
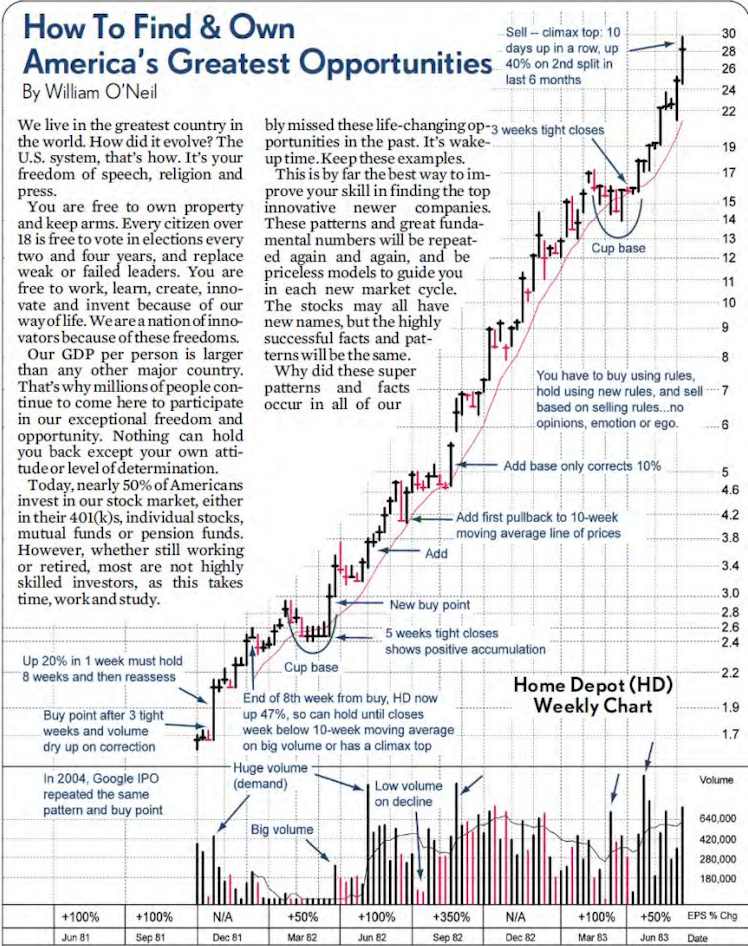
The same is true if you look back at the best performing stocks in history. The 10 week sma is consistently an area of support.
Here's is $HD's powerful move in 1981
The red line is the 10 week SMA.
The 30 week moving average is just as useful for investors and traders for identifying the stage of the stock
Stage 1 - Basing
Stage 2 - Advance
Stage 3 - Consolidation
Stage 4 - Distribution
The big money in made during S2 Uptrends and the big money is lost in S4 Declines
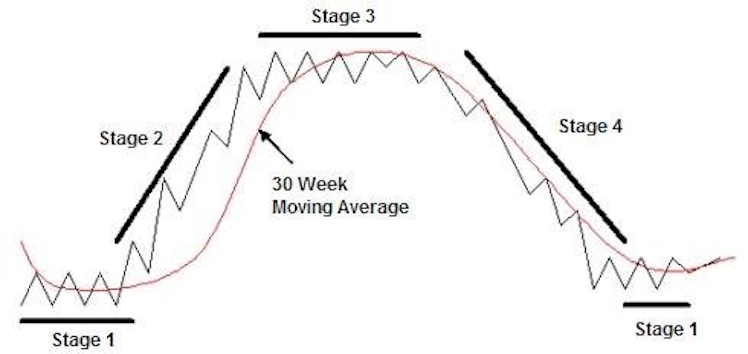
- S1 - Price chops back & forth around a declining to flat 30 week MA
- S2 - Starts with a big volume breakout from a base, Price starts trending above a rising 30 week MA
- S3 - Price chops around a flattening 30 week ma
- S4 - Price starts trending below a declining 30 week MA
Stage Analysis, developed by Stan Weinstein, shows the long term trend of any stock.
Both investors and traders should focus on stocks beginning or in Stage 2 Uptrends.
My Interview with Stan Weinstein: https://youtu.be/FtAshnE3MwM
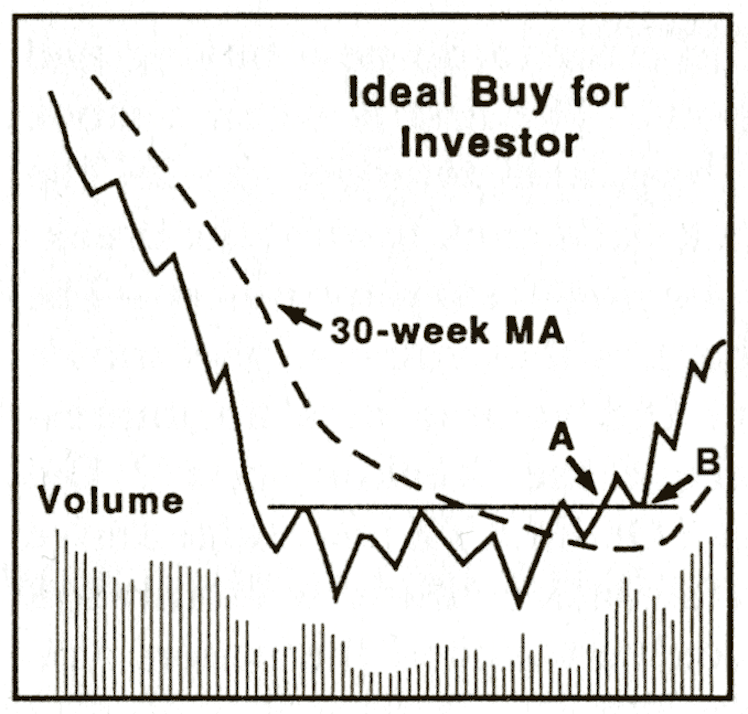
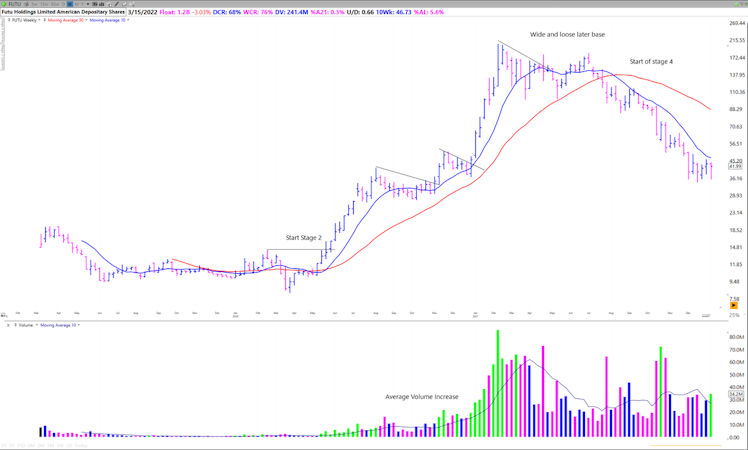
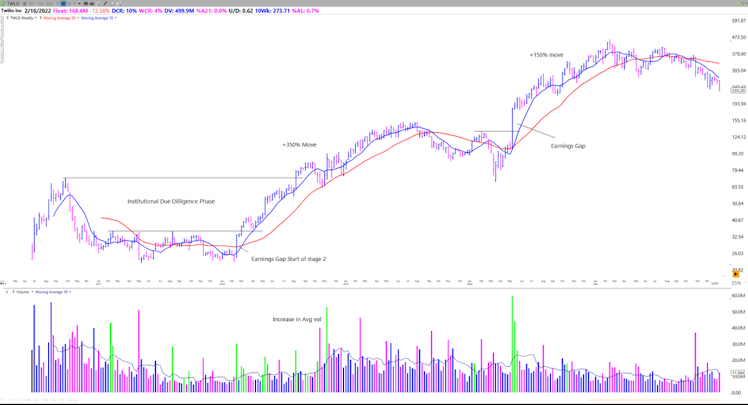
- Weekly Charts reveal the footprints of Institutions.
Institutions can't hide when they begin and continue accumulating positions.
Look for.
✅ Huge Volume Spikes
✅ Tight Weekly Closes
✅ Increasing average weekly volume
Look at the chart of $TSLA since 2019. Notice how breakouts from bases are accompanied by volume well above the 10 week average, & within bases volume dries up.
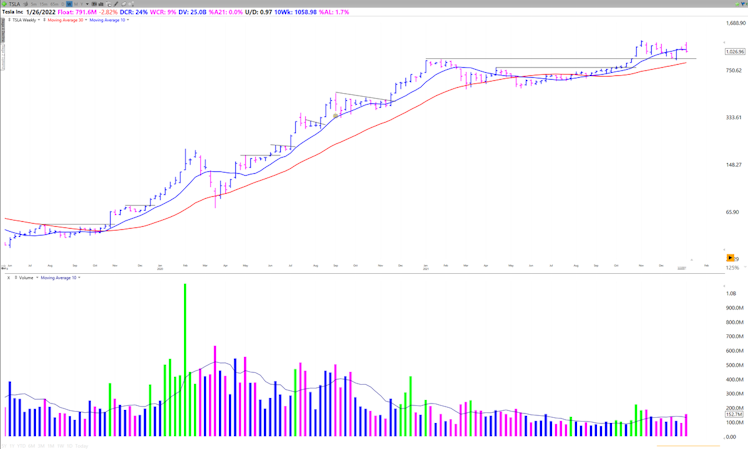
Look at significant volume weeks and determine based on context and CR if a stock is being accumulated or distributed
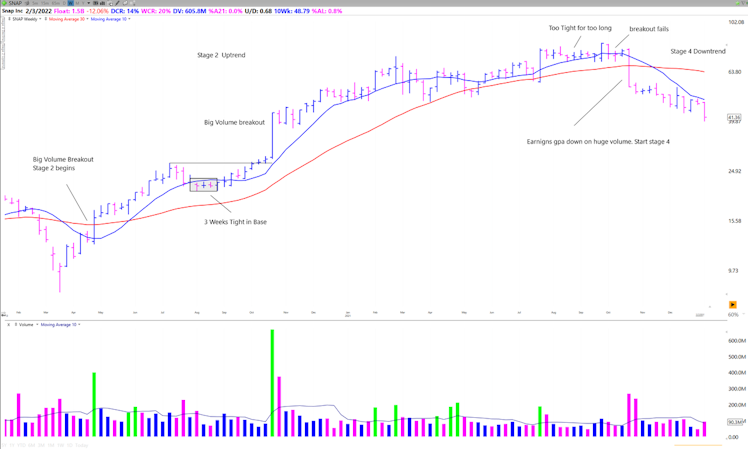
$SNAP is a great example of tight closes within a base suggesting institutions drew a line in the sand and were accumulating shares.
Also look for this after a breakout to see if institutions are still building positions
$FUTU is an example of weekly volume increasing during a move. As it does this the stock becomes more liquid and larger institutions can get involved.
- Focusing on Weekly charts reminds us that the biggest moves come from larger patterns.
100% + moves begin with a long basing period and a strong breakout.
Focus on 👇
✅ Recent IPOs after their first big base
✅ Mature names after they have consolidated
$NVDA has had multiple moves out of long basing patterns. This allows shares to fully transfer from short term players to longer term institutions
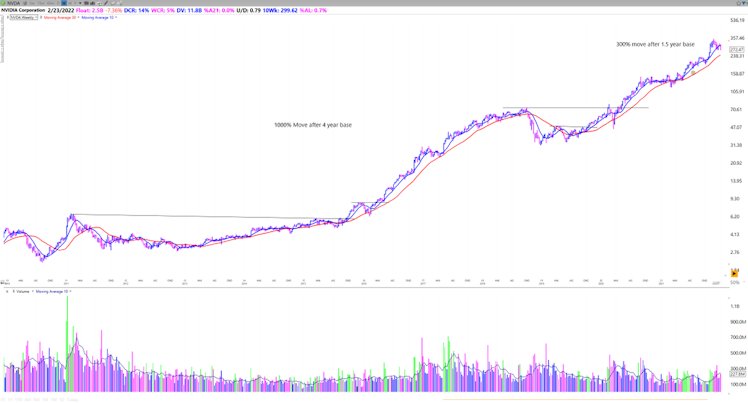
Recent IPOs often start long term moves out of their first primary base.
Read "The Lifecycle Trade" for more info 📘amzn.to/3n5epJR
- Weekly Charts Remove the Noise. Limit Decisions
As mentioned previously, weekly charts remove intraday and daily chop. The stock can move a lot throughout the week but it is the institutions who control where it closes.
The weekly action and trend supersedes the intraday and daily movements of a stock.
Always make sure you are stacking probabilities and trading with the weekly trend.
For investors, Weekly Charts are a great way to use technical analysis and time trades since there are a lot less signals to work with.
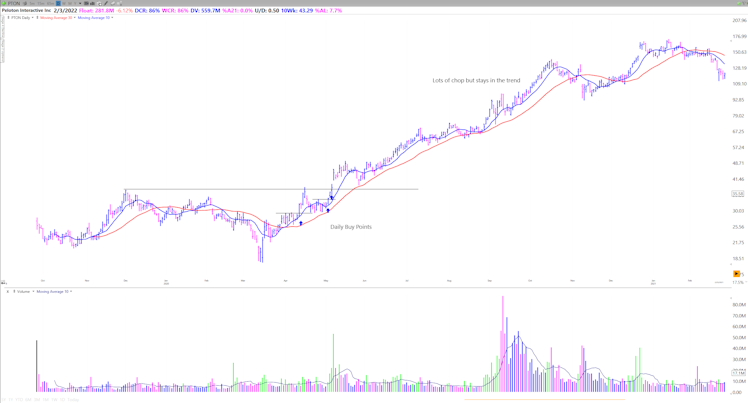
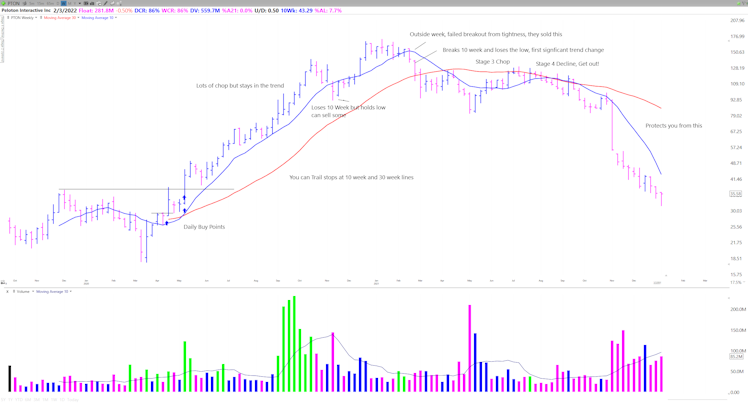
Position and even swing traders should also consider buying on a daily chart but then switching over to a weekly once the trend is established
This is especially helpful after a significant correction when trends can last a lot longer than we think and daily noise can scare us out.
Here's an example with $PTON buying on the daily and then managing the position on a weekly.
When the weekly trend changes PAY ATTENTION.
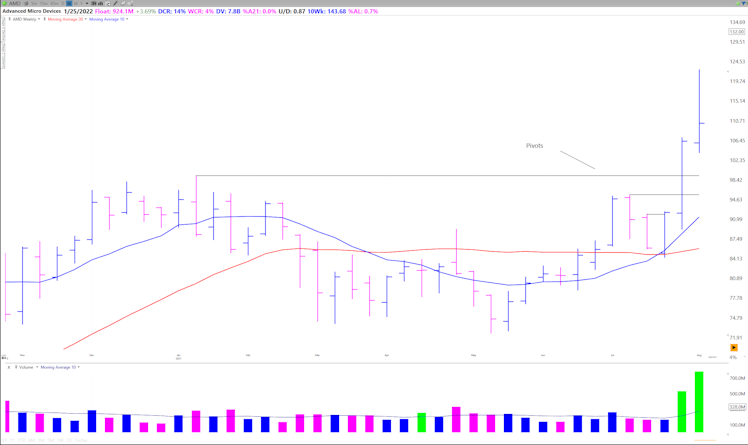
- Identify Key Levels and Pivots
Weekly chart highs and closes are excellent pivots to use on a daily chart for shorter term traders.
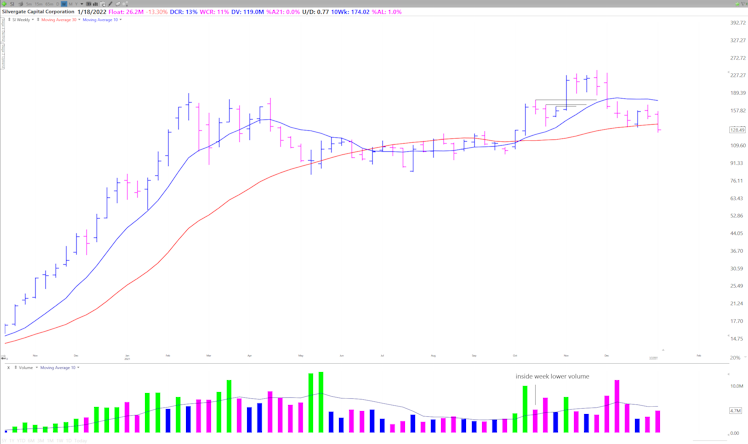
Inside weeks especially provide clear pivots for swing traders. These are volatility contractions on a lower timeframe.
Trading off weekly levels is a great way to improve the probability of a trade working since the weekly players are involved as well not just the daily and intraday traders.
I hope you all found this short article helpful!
If you did please Upvote, Repost, and reply with your thoughts
Also tag anyone else who you think would find it interesting. Take care!
Already have an account?