Trending Assets
Top investors this month
Trending Assets
Top investors this month
@etfs
Christian
$10.3M follower assets
I consider myself an "Eternal" bull on stocks, but I only trade ETF's so to avoid the company specific risks. I also consider myself a technical trader using technical analysis more than anything else.
38 following35 followers
$DIA, (the Dow Jones Industrial Average tracking stock), is leading the way higher. It triggered a daily chart up trend this week along with $SPY and $QQQ and is the only one that has a monthly candle close above the monthly down trend resistance level and could trigger a monthly chart up trend at the candle close at the end of the month, if that happens the next resistance level will be the all time high.

post media
Imgur
imgur.com
Discover the magic of the internet at Imgur, a community powered entertainment destination. Lift your spirits with funny jokes, trending memes, entertaining gifs, inspiring stories, viral videos, and so much more from users.

New Year
Following the guidelines at the URL below every week will not only help you be happier and healthier than having all the money in the world, it will also help your ability to proverbially get all the money in the world too.

I follow them myself getting the aerobic portion through a recumbent stationary bicycle at home and the strength training through dumbbells at home as well.

Happy New Year


$SPY holding above its weekly chart up trend support level and closing above the last 2 weeks high's, and above its daily chart down trend resistance level today, it could trigger a daily chart up trend next week. The monthly chart is in a down trend and the market has not tested its down trend resistance level yet.


post mediapost media
Imgur
imgur.com
Discover the magic of the internet at Imgur, a community powered entertainment destination. Lift your spirits with funny jokes, trending memes, entertaining gifs, inspiring stories, viral videos, and so much more from users.

$SPY daily chart down trend resistance level, (horizontal red line). The $SPY


could turn to an up trend next week if it has an up week. The weekly chart is still in an up trend with the support level at the horizontal green line on the weekly chart. The weekly doji candle close this week is bullish too.

post mediapost media
Imgur
imgur.com
Discover the magic of the internet at Imgur, a community powered entertainment destination. Lift your spirits with funny jokes, trending memes, entertaining gifs, inspiring stories, viral videos, and so much more from users.

Stock Market
$DIA , the Dow Jones Industrial Average tracking stock, closed its monthly candle above the monthly down trend resistance level yesterday and has lead the way higher amongst the major averages, (S&P500, NASDAQ 100). It could turn to an up trend as early as the next candle close at the end of the month. I have it in a weekly and daily up trend, already.

post media
Imgur
imgur.com
Discover the magic of the internet at Imgur, a community powered entertainment destination. Lift your spirits with funny jokes, trending memes, entertaining gifs, inspiring stories, viral videos, and so much more from users.

Stock Market
The Dow Jones Industrial Average, $DIA, is looking good, it closed at a swing high today.
post media

Stock Market
$SPY is looking better on the charts to me. I have it in a monthly down trend and triggered a weekly and daily up trend today, at the close.
post media

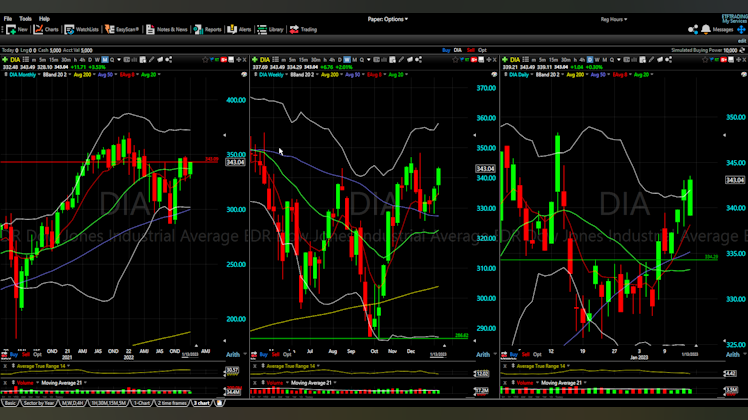
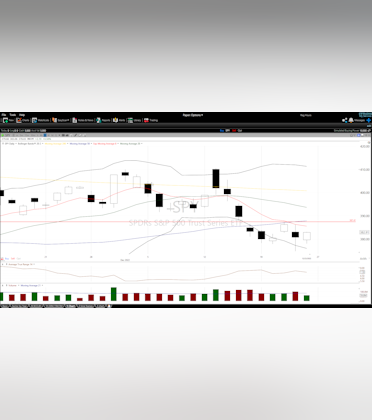
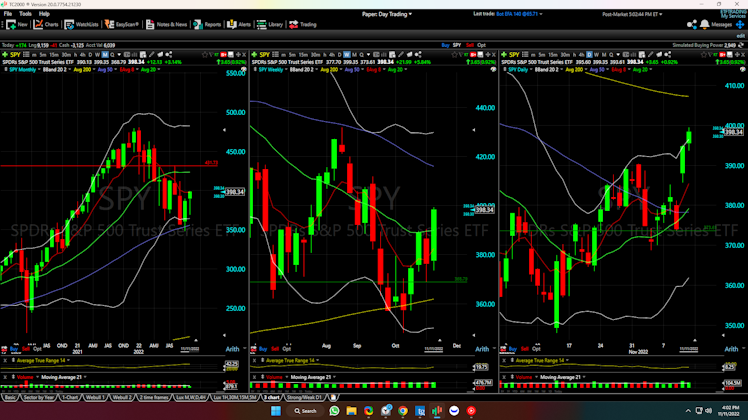
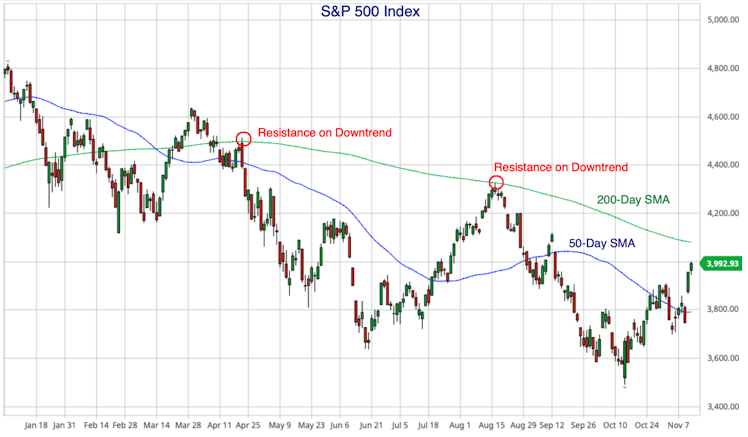
There's a nice short-term uptrend with the S&P 500 index now trading strongly above the 50-Day simple moving average.
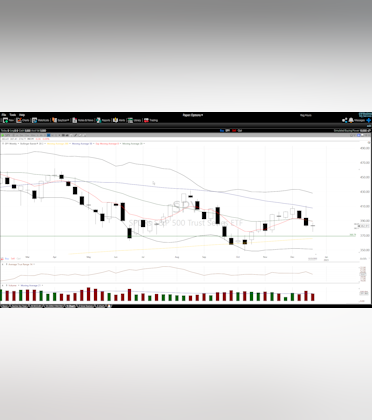
They way I interpret the daily chart as a trend follower is that the market has been making short-term higher highs, but we're still in an overall downtrend. So I think I'm seeing it similar to you when you look at the monthly chart.
I'd like to see this recent uptrend sustained, and I need to see it break the declining 200-Day SMA which has been a definitive line of resistance twice in the past. Then I'd like to see the market break above the 4,305 level (previous significant high) before I can be convinced a recovery is well underway.
The next few trading days are going to be key to see if this recent strong move can be sustained, or if buying pressure gets exhausted and we just fall into a funk again and fill in that gap.
Image upload
+ 1 comment
I have $ESTC in a monthly, weekly, daily and 4 hour

chart down trend, but the weekly chart has the last 2 candle closes as doji's so could be at least a short term bottom here.
post media

Watchlist
Something went wrong while loading your statistics.
Please try again later.
Already have an account?