Trending Assets
Top investors this month
Trending Assets
Top investors this month
@topcornerinvest
Jorgen - Top Corner Investing
Here to learn & share what I read & write
34 following23 followers
Write-up: The Estée Lauder Companies ($EL)
Here is the link to the original post on my website: http://topcornerinvesting.com/2023/07/21/estee-lauder-companies/

The Estée Lauder brand was founded in 1946 by Mrs. Estée Lauder and her husband. In many ways, Estée Lauder pioneered the prestige beauty industry in the United States through her unique marketing skills and willingness to demonstrate her own products on women at no cost. In addition to her burning passion for cosmetics, Estée Lauder was also a brilliant saleswoman with a vision to “never underestimate a woman’s desire for beauty.” As a result of the word-of-mouth marketing from satisfied customers, Estée Lauder slowly but surely turned into a prestige beauty empire that is still thriving today (David Senra of the Founders Podcast brilliantly covers her biography A Success Story for those interested).

“I want to paint a picture of the young girl I was. A girl caught up mesmerized by pretty things and pretty people. My drive and persistence were always there, and those are qualities that are essential for building a successful business. Still, I sometimes wonder if I had set my heart on selling tassels, cars, furniture or anything else but beauty, would I have risen to the top of a profession? I doubt it. I believed in my product. I loved my product. A person has to love her harvest if she's to expect others to love it, and beauty was such a bountiful harvest."

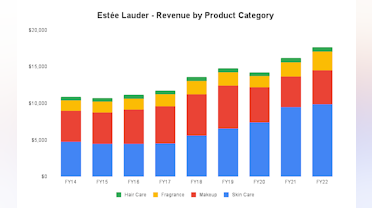
Today, The Estée Lauder Companies owns a portfolio of 19 fully-owned brands as well as the licensing rights for brands like Tom Ford and AERIN and 76% ownership of Deciem Beauty Group. Estee Lauder separates its product into four different categories (in addition, a fifth category named “other” includes ancillary products and services that represented a tiny 0.3% of 2022 revenues):

  • Skin Care represents about 83% of operating income as of FY22 and grew 4% year-on-year. This category includes the Estée Lauder brand (which also is big in makeup and fragrance) and prestige brands like Bobbi Brown and La Mer.
  • Makeup makes up 4% of operating income as of FY22, led by the famous M·A·C brand which the company acquired in 1998.
  • Fragrance grew 30% YoY and makes up about 13% of operating income. This product category is the fastest growing category, partially because fragrance sales plummeted during the early stages of the pandemic but also from a few successful product launches from brands like Jo Malone London and Tom Ford Beauty.
  • Hair Care reported a $28 million loss in FY22 and $19 million loss in FY21. This segment was arguably hit the hardest over the past few years as salons and retail stores were closed; the operating loss over the past two fiscal years have mainly been a mix of pandemic related closures + increased expenses to support the recovery of the stores.

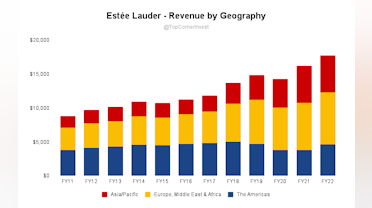
For the majority of the 75+ years The Estée Lauder Companies has been in business, the United States has been the largest market and where the company deployed most of its resources. However, the story has evolved over the past two decades or so with slowing growth in the Americas (mainly U.S.) and an increased focus on growing market share globally. For example, net sales in the Americas grew about 2.5% annually between FY10 and FY22. Net sales in the Asia/Pacific region increased by ~11% over the same time frame. Further, the United States represented 38% of overall revenues in 2010. 12 years later (per FY22), that number was 22.6%. Mainland China is now the largest country in terms of revenue with about 34% of company-wide net sales.

This shift has happened for a few reasons. Firstly, the demographic trend in many emerging markets is that a larger percent of the population becomes a part of the middle class. These people will typically spend a larger portion of their income on discretionary items such as beauty products. This trend is forecasted to continue in countries like China and India. For example, growth in per capita spend on prestige beauty increased by 185% in China between 2015 and 2020. In the U.S., that number was 9%.

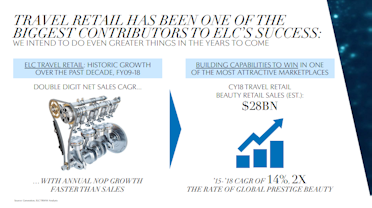
Second, travel retail has become a more important growth channel of the global prestige beauty market (Estée Lauder solely focuses on prestige beauty). Despite the various travel restrictions over the past three years, travel retail has over the past decade been one of the fastest growing channels within global prestige beauty. This will again benefit Estée Lauder as international travel continues the pre-pandemic trend of steady growth: Travel retail has been one of the biggest contributors to ELC’s [Estée Lauder Companies] success.” As a larger percent of the population in emerging markets spend more on travel as their discretionary income rises, Estée Lauder gains an increased number of potential customers. Interestingly, 59% of prestige beauty buyers’ first purchase is in travel retail. That explains much of why travel retail is an area where the company spends much of its attention trying to expand consumer reach and conversion.

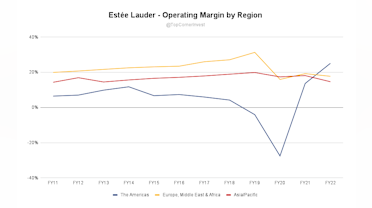
The increased dependence on emerging markets and travel retail also helps explain why Estée Lauder has had a difficult past few years. For example, reported operating income decreased by 60% and earnings per share declined 72% in the most recent quarter (Q3 2023 compared to Q3 2022). The company also lowered its fiscal year guidance, blaming a volatile recovery in travel retail and lower conversion of travelers to consumers in prestige beauty.

At the risk of being too short-term oriented, I think it’s evident that Estée Lauder’s management overestimated the pace of the recovery in Asia. The company is also working through issues with elevated inventory at several retailers, in turn leading to lower replenishing orders and hence part of the reason why Estée Lauder had to lower its FY23 outlook. The increased uncertainty, politically as well as consumer behavior, is perhaps part of the challenge that comes with betting on China and emerging markets for growth. Over the long-term though, I think it’s reasonable to believe that Estée Lauder’s strong portfolio of brands will carry them through most challenges.

Financials

Since FY10, Estée Lauder has spent about 62% of its capital on capital expenditures and 38% on acquisitions. Capex varies from new manufacturing facilities, distribution capabilities and the opening of freestanding stores and retail stores around the world, among other investments. Over the past few years, additional investments were also made to support the reopening of stores that were closed during the pandemic.

Moreover, the company announced a restructuring program in 2020 to address the changing landscape of retail such as the shift to online and decrease in brick-and-mortar sales, especially in the United States and United Kingdom. This has required additional investments to reorganize the distribution networks as the company has closed several department store counters in order to direct resources to the much faster growing online channel.

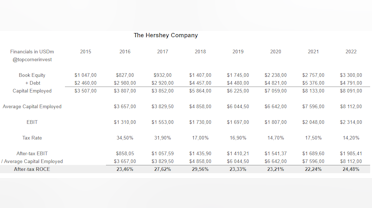
(For what it’s worth, tax rate fluctuates with the geographical mix of earnings. We will likely see more of this going forward as emerging markets revenues become a larger part of Estèe Lauder overall sales. In addition, a one-time repatriation tax increased the FY18 effective tax rate to 43.6% and materially impacted the after-tax ROCE as shown above.)

The purchase of skin care brand Dr. Jart+ for ~$1.2 billion in December 2019 is the most recent acquisition of material size. In total, Estèe Lauder has spent north of $4 billion on acquisitions since FY10, mainly aimed at expanding distribution channels and geographical reach. For a company that opportunistically pursues M&A, a long-term track record is likely one the best way to judge if the acquisitions have created value for shareholders. The Estèe Lauder Companies has arguably one of the best track records in the beauty industry as evidenced by its current portfolio of brands.

An example is Estèe Lauder’s first brand acquisition back in 1995; the company helped scale Bobbi Brown Cosmetics from a local New York City makeup brand into a global powerhouse. For the record, not all purchases have been successful - such as Becca Cosmetics that was initially acquired in 2016 before it was shut down just five years later. However Estèe Lauder Companies arguably still has one of the best track records out there when it comes to acquiring other brands.

Valuation

Below is my current financial model for Estèe Lauder:

For FY23 (ended June 30 but numbers are not public yet), the company is guiding for a 10-12% decline in revenue and unadjusted EPS in the range of $3.29 to $3.39 - I assume the midpoint of that guidance in the model.

In FY24, I assume ~10% revenue growth with EPS around $5.30 (only a 10% increase from FY19) as we should approach a more or less normal operating environment for Estèe Lauder again. From there, Estèe Lauder could be earning ~$8.3 in EPS five years from now with high single-digit topline growth and slightly increasing profit margins. That’s about 22x 2027e earnings at today’s stock price ($190).

I believe a fair value in the range of $150-$170 per share is reasonable for Estèe Lauder. That implies a terminal P/E in the high 20s to low 30s for a company with extremely strong brand equity, pricing power and multiple engines of growth for the foreseeable future (such as a growing customer base in several emerging markets and the growth of travel retail).

While the current price is not a bargain, I also think it's unfair to write it off as overvalued simply because it’s trading at a headline P/E of 62x LTM earnings. Earnings over the past three years have been depressed to a large degree as a consequence of lockdowns and travel restrictions in most markets. If The Estèe Lauder Companies is able to operate in a more or less normal environment in FY24 (for the first time in many years), I think we could see a shift in investor sentiment to once again appreciate the business and the durability of the brands in the portfolio.

If Mr. Market continues with his pessimistic view of the company and the share price drops further, I will consider adding Estèe Lauder to my portfolio. For that to happen though, I would need to make sure I’m comfortable with much of the future growth coming from emerging markets and through channels such as travel retail that is cyclical in nature. For now, I will be watching from the sidelines on this one.

Thanks for reading!
post mediapost mediapost mediapost media
Colossus - Business Podcasts
#136 Estée Lauder
David Senra is the host of Founders, where he studies history's greatest entrepreneurs. This is what he learned from reading A Success Story by Estee Lauder.

Write-up: Watsco ($WSO)
This write-up was first published on my website: http://topcornerinvesting.com/2023/04/19/watsco-inc/

Watsco is the largest distributor of HVAC/R (heating, ventilation, air conditioning & refrigeration) equipment and parts in North America. The business was incorporated in 1956 as a manufacturer of air conditioning parts before switching to its current distribution strategy in 1989. At the time of the strategy switch, Watsco was valued at a market cap of $22 million. In 2011, it became a 100-bagger at $2.2 billion. Today Watsco is valued at about $12 billion, up 545x since 1989.

Watsco’s customers are typically contractors and technicians who repair or install HVAC/R systems for their respective customers (typically residential, commercial or new housing). In 2022, the sales mix was as follows:
  • Residential HVAC equipment (56% of revenues)
  • Commercial HVAC equipment (13% of revenues)
  • Other HVAC products (28% of revenues)
  • Refrigeration (3% of revenues)

To serve its customers, Watsco operates 673 locations across 42 U.S. States, Canada, Mexico and Puerto Rico where contractors/technicians can buy equipment, supplies and tools. Watsco generally expand its store footprint (chart below) from M&A activity; for example, Watsco increased their presence in the Midwest and the South through 3 key acquisitions that brought them 56 new locations in 2021. Similarly, Watsco formed three different joint ventures with Carrier between 2008 and 2012 which expanded the businesses into Canada and new geographical areas. To read more about Watsco’s past and future acquisition activity, I highly recommend this memo from Andy (@bizalmanac on Twitter).

However, they are slightly dilutive to shareholders. For example, Watsco issued ~4.25 million new shares to fund the joint ventures with Carrier. Shares outstanding has increased by about 2% on average annually since 2008.

Why has Watsco been successful?

Distribution businesses like Watsco, Pool Corporation and W.W. Grainger have all delivered outstanding long-term shareholder returns. In Watsco’s case, this business model works well for a few different reasons - The HVAC/R industry is fragmented with no large direct competition. As the largest distributor, Watsco has reached a scale that allows the company to take advantage of its large network to support and serve customers faster and better than competitors. As mentioned earlier, the scale also allows them to acquire other businesses that will add new products and locations - Watsco has expanded into Canada, Mexico and Puerto Rico over the years and further expansion will be an important source of growth going forward as well. Watsco's size also gives them some purchasing power from its suppliers which in turn could drive margin expansion.

Further, Watsco’s business is benefitting from the growing installed base of A/C units. These units will need regular maintainance and service over the next 10-15 years until it needs to be replaced with a new one. Per Watsco (take the ESG angle for what it’s worth) there will also be a significant need for more energy-efficient HVAC systems to meet new efficiency standards:
“Our company and our customers are all capable of driving change that is good for the consumer, good for the environment, and good for our business. The products we sell have a direct and meaningful impact on overall energy consumption and CO2 emissions. As consumers replace older existing systems, particularly with high-efficiency systems, consumers save on energy costs and reduce greenhouse gas emissions. Upcoming federal regulatory changes will influence what products consumers choose from and how contractors present innovative solutions to homeowners.” (Watsco 2021 10-K)

(Image from Watsco 2023 Investor Presentation)

Part of the success can also be attributed to the ownership culture. Watsco’s compensation structure is fairly unique in that key or high-potential employees are rewarded a large number of restricted shares (about 130 employees own close to 3 million restricted shares as of 2022). The owners can vote and collect dividends with the restricted shares but the shares do not vest until “retirement age” at 62 or later. If you leave Watsco you also leave those shares behind. The goal is to create a long-term ownership mindset where management makes decisions that are good for Watsco in the long run:

“I tell our leaders all the time that we’re a public company, it’s important to have good quarters, but what we’re really after here is good quarter centuries, right?” -A.J. Nahmad, Watsco President

Financials

Watsco’s revenue growth has accelerated rapidly over the past three years compared to the last decade. Between fiscal years 2020 and 2022, revenues increased at 20% annually versus ~7.5% between 2013 and 2022 (and 15% annually since 1989). Furthermore, Watsco more than doubled its net income over the same three-year period and expanded profit margins from 5.3% to 8.3%.

Revenue growth will undoubtedly slow down as we move on from an environment which strongly benefitted anything home improvement related (companies such as Watsco, Home Depot and Pool Corp were arguably all pandemic winners). The question is if the profit margin also will revert back to its long-term average of ~5%. The argument as to why margins could permanently remain at 7-8% is because Watsco has taken market share over the past few years - per company reports, Watsco’s market share has increased from 12% in 2018 to 15-18% at fiscal year-end 2022. The company also used the pandemic to improve its technology platform to the benefit of customers (online ordering is more efficient, allowing contractors to complete more jobs) and Watsco itself (more platforms to sell from at any time of the day). On the other hand, reduced demand from a housing downturn could eat into margins if Watsco has to clear out inventory at lower prices. While this might be short-term I think it's reasonable for investors to think about the mean reversion from some of the pandemic gains.

Over the past 20 years, Watsco has spent $802 million on acquisitions and $288 million on capex. Watsco has also distributed $2.4 billion as dividends to shareholders over the same time period. With incremental ROCE at about ~40% for the past decade, one could probably wish Watsco would re-invest more of its capital in the business and not pay it out as dividends to shareholders.

I think this partly goes back to the ownership culture in the way that Watsco wants to reward its restricted shareholders and employees that own shares in the business by paying out a dividend on a quarterly basis. Another reason could be that Watsco doesn’t want to aggressively acquire other companies; Watsco wants to be seen as the right “home” for family-owned HVAC businesses that are looking to sell for various reasons. In many cases, these small businesses are happy to be acquired by Watsco rather than private equity because of Watsco's track record. Nevertheless, Watsco has significantly increased its cash pile over the last few years and likely in a good position to strike if any opportunities should arise.

Valuation

Below is my current earnings model for Watsco

The underlying assumptions are that revenue growth slows to 10% in FY 2023 and 5% for 2024 through 2027, profit margins stay slightly above the long-term average and the annual dividend grows at 10% per year.

I find it fairly difficult to forecast Watsco’s earnings over the next few years for a couple reasons:

(i) Management doesn’t provide guidance. The only certainty we have is that the annual dividend (paid quarterly) will be raised for $9.80 for the 2023 fiscal year.

(ii) Watsco’s business is correlated to the housing market. I don’t have any edge in forecasting the housing market but it might be there is a chance that housing (new housing development, home transactions or similar) will slow down compared to prior years. This will hurt Watsco’s revenues but it’s difficult to say to what extent.

The current price of 23x forward earnings does not seem to provide much margin of safety given Watsco’s exposure to housing/real estate. I think a fair value in the range between $230-$250 is more reflective of the current business (for the record, Watsco was trading at $240 in July 2022) and the challenges it faces over the next few years.

I consider Watsco a great business and I’m adding it to my list of excellent companies (similar to companies like Hershey and O’Reilly that I have written about before) that I will be ready to purchase if Mr. Market provides me the opportunity.

Thanks for reading!
post mediapost mediapost mediapost media
bizalmanac.substack.com
Carrier's Gift
Analyzing and Forecasting Watsco's Acquisition Activity

Write-up: O'Reilly Automotive ($ORLY)

In the book 100 Baggers, author Chris Mayer writes: “I’d add that many of his chosen stocks had top-management teams that made good capital decisions about how to invest company resources. There was often a large shareholder or an entrepreneurial founder involved. These can overcome the growth hurdle. One interesting example here is AutoZone. It was a 24-bagger in Martelli’s study [which looked at 10 baggers over the last 15 years] despite registering ho-hum growth rates of 2-5 percent.”

While Mayer mentions AutoZone as an example of a company with spectacular returns, O’Reilly Automotive has also delivered similar results over the past few decades. Since 2000, O’Reilly has compounded EPS at an average annual rate of ~21% - and AutoZone’s numbers are similar - despite slower top line growth. Both are among S&P 500’s best performing companies since the turn of the millennium, an impressive feat for two niche retailers.

The automotive aftermarket industry (essentially meaning products and services purchased for vehicles after the original sale) has experienced some big tailwinds over the past decades. The main drivers are longer car lives and increasing numbers of cars on the road. Because O’Reilly typically services older vehicles that are out of warranty and require more maintenance compared to new cars, an aging vehicle population means more customers. Americans also drive more (as measured by miles driven per year), leading to higher demand for parts and maintenance. Per O’Reilly, these industry drivers are not expected to decline in the future.

The industry is also very fragmented despite the consistent growth O'Reilly and AutoZone have seen over the past few decades: “The automotive aftermarket industry is still highly fragmented, and we believe the ability of national auto parts chains, like O’Reilly, to operate more efficiently and effectively than smaller independent operators will result in continued industry consolidation,” (2022 10-K). O’Reilly has historically added 100-200 new stores per year and only occasionally engage in M&A. For example, the jump in stores from 2007 to 2008 was due to the acquisition of CSK where O’Reilly acquired 1,342 new stores.

O’Reilly caters to both DIY (do-it-yourself) customers and professional service providers, with about 56% of sales coming from DIY and 44% from professionals for the 2022 fiscal year. DIY is more consolidated due to the growth of the largest auto parts chains in the U.S., but the fragmentation in professional services appears to be an opportunity for O’Reilly. To take advantage of this, O'Reilly continues to invest in its distribution network to ensure efficient delivery of parts to its stores. This has become one of O’Reilly’s competitive advantages - through its 28 distribution centers and 375 hub stores across the country, most O’Reilly retail stores have access to same-day delivery of a huge number of parts. Fast and cost efficient delivery is also important to professional customers who typically decide where to order parts from based on these factors. In turn, distribution efficiency will drive higher adoption from professionals and same-store-sales growth (see chart below) going forward.

It’s also worth mentioning opportunity for international expansion as O'Reilly currently operates 42 stores in Mexico. Given the plans to open the first distribution in Mexico later in 2023, it seems reasonable to believe that significant efforts will be made to further expand store foot print within the country as well.

Financials & Capital Allocation

As I quoted in the intro, O’Reilly and AutoZone are sometimes referred to as slow growers - sort of the "slow and steady wins the race" type of companies (for the record, these are the businesses I would like to own myself). Perhaps rightly so considering the fact that same-store sales are up about ~4.5% CAGR since 2013. However, O’Reilly has re-accelerated revenue growth after a few “slow” years between 2016 and 2018. I think it’s fair to say that the pandemic and the spike in inflation that followed had a positive impact on the numbers because O’Reilly could pass on most of the higher prices to customers. Topline growth will likely revert back to 6-9% annually moving forward.

Nevertheless, the elephant in the room is the massive growth in EPS and free cash flow per share. Since the share count peaked in 2010, O’Reilly has repurchased over 54% of its shares outstanding, equivalent to roughly 6% on average annually. What’s interesting is that the dollar value of the repurchases is higher than what O’Reilly generates in free cash flow most fiscal years (see chart below). To finance a portion of the buybacks, long-term debt has increased from $1.4bn in 2015 to $4.4bn at the end of 2022.

For what it’s worth, I don’t believe this is a red flag because O’Reilly has sufficient interest coverage (18x EBIT/Interest Expense in 2022) and very predictable cash flows. However I’d be interested in hearing from management how they think about the increased leverage and what the goal is in terms of a target leverage ratio or debt-to-capital ratio or similar.

Furthermore, ROCE has also trended upwards along with the increased debt. There are clearly attractive opportunities out there for O’Reilly to invest its capital which is magnified by the leverage. I like to think that management will take a more conservative approach to capital allocation when O’Reilly reaches full maturity, for example by instating a dividend or repaying some of the debt. As for now, and most likely for many years to come while O’Reilly is still growing, I don’t see an issue with the leveraged buybacks.

One of the biggest lessons I have learned from researching O’Reilly is how powerful buybacks can be, but also why most companies might be better off allocating their capital in other ways. I think the reason O’Reilly (and AutoZone) has been so successful with this approach is the combination of industry tailwinds and the ability for these companies to take market share. O’Reilly has done very well strengthening its competitive advantage through the investments in distribution centers, but the growing customer base (from the aging vehicle population) has undoubtedly played a non-trivial role in the success story. I don’t mean to discredit O’Reilly (the disciplined capital allocation is truly impressive), the point is more so that investors shouldn’t just demand companies to buy back shares simply because O’Reilly has been successful doing so.

Valuation

O’Reilly shares are currently trading at ~24x LTM earnings or a ~4% free cash flow yield based on 2023 estimates.

Below is my simple model on O'Reilly's earnings with the simple assumption that revenue growth will compound at 8% annually over the next few years (similar growth as between 2013-2019), profit margins will be at 14% and the company will buy back about 5% of shares outstanding per annum. I think it's fair to assume that the earnings multiple won't deviate too much from where it is currently and so ORLY shares seems to be fairly valued at the current price (given that my assumptions are fair).

I also attempted a reverse discounted cash flow (DCF) to see what the market expects at today’s price of $822 per share given a discount rate of 11%. If you think 18x FCF is a reasonable multiple in Year 10, the market currently expects O’Reilly to grow FCF by about 10% per year. Remember that FCF has compounded at 19% over the past 10 years, so it doesn’t look unreasonable.

Closing thoughts

Even though O'Reilly is a truly unique, high-quality company combining growth with industry tailwinds, a consistent capital allocation and a fair valuation, there is still one issue remaining that I am struggling with; I can't help but feel that I am too late to the party. O'Reilly is now a $50bn company with shares trading close to all time highs and the stock has pretty much gone up and to the right since going public in 1993. How long can this continue for? I don't have the answer and I need to give it some more thought before I make a decision. Until then, O'Reilly will probably continue to climb.

Thanks for reading!
post mediapost mediapost mediapost media
Jorgen - Top Corner Investing
O’Reilly Automotive
In the book 100 Baggers, author Chris Mayer writes: “I’d add that many of his chosen stocks had top-management teams that made good capital decisions about how to invest company resources. There wa…

Write-up: The Hershey Company ($HSY)

When Milton S. Hershey returned back to his home state of Pennsylvania in 1886 after several failed business ventures, he had no idea he would end up laying the foundation of a confectionery business that would be thriving 100+ years later. Mr. Hershey had decided to focus on making chocolate after trying his luck as a candymaker and caramel manufacturer. By experimenting with chocolate bars and chocolate-covered caramels, Hershey finally made enough money to open his own factory after years of struggle. In 1903, Milton Hershey broke ground for the Hershey chocolate factory on Chocolate Avenue in Hershey, PA.

Today, Hershey is a ~49 billion dollar company with a portfolio of household names such as Hershey’s Kisses, Reese’s, Kit Kat, Jolly Rancher, SkinnyPop and Dot’s Homestyle Pretzels. In 120 years, Hershey has progressed from being a producer of chocolate to envisioning a future as a “snacking powerhouse,” in the company’s own words.

Per Statista, Hershey is the leader in the U.S. confectionery industry with a market share of 33.5% just ahead of Mars (M&M's, Snickers and more). Hershey's market share has grown from 31% in 2016 and 29% in 2011. However, Hershey’s confectionery business is a mature, fairly slow-growing segment (4.1% CAGR from 2017 to 2021). The fastest growing part of the company is the snacking segment, an area which Hershey has ramped up its investments over the past decade.

At the last Investor Day in 2017, Hershey outlined the opportunity that exists in the snacking category based on changing consumer trends, "global snacking is a ~$1 trillion opportunity." To account for the increased emphasis on snacking, Hershey recently started to report its operations in three segments; North America Confectionary, North America Salty Snacks, and International. Previously, all operations in North America were reported under the same segment.

(Numbers from Hershey 10-Q for 4Q22)

The data for the North America Salty Snacks segment only goes back to 2019. Back then, the segment did $410 million in revenue (~5% of total revenue). Fast forward to the end of fiscal year 2022 and the same segment has surpassed $1 billion in annual revenue, now representing a meaningful 10% of Hershey’s total revenue. Most of the growth is non-organic (the 2021 acquisitions of the snack manufacturer Pretzels as well as Dot’s Pretzels were big contributors). The increased investments in snacking has provided good results for Hershey so far which makes it reasonable to think that we will see more acquisitions in the future.

The scheduled Investor Day on March 22 will likely provide an update on Hershey’s market share and what investors can expect of the different segments going forward.

Financials

The snapshot of Hershey’s financials is a good way to represent the pricing power of the business. Despite slow revenue growth, operating income grew at a faster rate and EPS increased at double-digits annually over the past 5 years.

The most recent earnings report and guidance for 2023 drives this point home:

“North America Confectionery segment income was $703.5 million in the fourth quarter of 2022, reflecting an increase of 12.9% versus the prior-year period. This resulted in segment margin of 32.3%, an increase of 90 basis points. Net price realization, volume gains and media cost efficiencies more than offset broad-based inflation, increased manufacturing and labor costs, and higher levels of brand and capability investments to drive segment income and margin expansion in the fourth quarter.”

Total revenue growth of 16.0% for the year (and 14.0% for the quarter) is impressive for a mature company. The ability to pass on inflation to the consumers while maintaining volumes shows the resilience of Hershey in difficult economic environments. In fact, volumes were also up 2.8% for the confectionary business and 4% overall in 2022. This level of pricing power is likely the reason Hershey and a select group of consumer staples have performed so well over the past year. In hindsight, Hershey was perhaps an obvious “flight to safety” in a time where high inflation was expected. The durability of Hershey’s business is matched by few others.

Hershey has also consistently generated high Returns on Capital Employed (ROCE) along with the continued reinvestments in its business.

After almost a decade of slow growth, Hershey seems to have been successful with its transition into the snacking market - at least if you judge by the numbers. I also think inflation arguably has been positive for Hershey because it has provided an opportunity to increase prices without much pushback. Even though there is heavy competition in candy, chocolate and snacks, the pricing pressure has been minimal because competitors have faced similar increases in input costs and consequently raised prices as well.

Just a quick note on debt - which could be relevant if we continue to see acquistions as Hershey continues to move into snacking. At the end of FY22 Hershey had ~$4.3B in net debt and about 17x EBIT/Interest Expense. Given the stable cash flows there is likely room to finance future deals with more debt as well.

Valuation

Hershey arguably doesn’t scream value at the current valuation of ~30x trailing P/E and ~30x 2023e free cash flow. Below is my basic financial model of Hershey’s future free cash flows with the assumptions of 12% FCF growth over the next 5 years, conservative share repurchases and a similar dividend growth rate we have seen the past few years.

I also played around with a reverse DCF (https://tradebrains.in/dcf-calculator/) to see what growth rates the current share prices implies. Let me explain: the current share price of ~$239 implies a fairly high free cash flow growth over the next 10 years. If you think a terminal 20x FCF multiple is fair, then the implied growth is somewhere close to a 12% CAGR over the next decade. Similarly, if you assume a 25x terminal multiple, the current stock price implies an annual average FCF growth of about 10%.

This assumes a 10% discount rate and share repurchases are not accounted for. For what it's worth, I think this exercise helps us think about what sort of margin of safety we find in today's stock price. It's fair to say that the current price reflects an optimistim around Hershey's future.

Over the past 1-2 years, the stock market has increasingly put stronger emphasis on profitability, predictability and consistency in earnings. Hershey’s 1-year return is about ~17% compared to the S&P 500 which is in negative territory over the same time frame. We have seen a similar “flight to safety” in other consumer staples such as Procter & Gamble, PepsiCo and Walmart, among others, which are all near all-time highs. While Hershey might not provide spectacular returns over the next years at the current valuation, there is no doubt to that Hershey stock is an excellent defensive pick - very much a coffee-can portfolio type of company with growing dividends and a solid track record. The last years have also shown that Hershey still has plenty of room to grow.

Hershey is not part of my portfolio as of today but I remain an avid fan of the company and I will happily be following along as the company embarks on its journey to becoming a “snacking powerhouse."

Thanks for reading!
post mediapost mediapost mediapost media
Trade Brains
DCF Calculator | Trade Brains
Warning: Garbage in, Garbage out. DCF Calculator is a very powerful tool to valuing stocks. However, this methodology is only as good as the inputs. For example, even a small change in inputs (like growth rate or discount rate) can bring large changes in the estimated value of the company.

MSCI - A Track Record of Financial Execution

“Free enterprise has undergone tectonic shifts before, especially as large numbers of people moved from farms to factories in the 19th century and from factories to offices in the 20th century. These earlier shifts brought about fundamental changes in the nature of work and economic progress. The same thing is happening today. MSCI’s business strategy can help us navigate and shape this new landscape. Our mission is to power better investment decisions for a better world: a more prosperous, more thriving, more sustainable world. This mission informs and inspires our efforts on climate and ESG. We see the evolution of free enterprise as a huge opportunity for companies and investors. But seizing the opportunity will require innovative tools, models and data. MSCI can provide them.”
-Henry A. Fernandez, MSCI CEO

MSCI is a company with a lot of moving parts. In simple terms, MSCI provides tools and solutions to the investment world through indexes, portfolio construction & assets allocation models, ESG (a segment growing at over 30% per annum over the past two years), analytics and more. MSCI reports revenue in four segments - index (~61% of 2021 revenue), analytics (27% of revenue), ESG & Climate (8% of revenue), and All Other - Private Assets (4% of revenue).

However, this write-up won't focus on explaining the various segments. Because there are so many different parts of the business to consider, let's instead focus on the overall financial performance of MSCI, the numbers and the valuation. This will help us understand why MSCI has compounded at 30.4% annually over the past decade - and why it is valued at a multiple which assumes rapid growth in the coming years as well.

Revenue, Free Cash Flow & FCF per Share

Since 2012, MSCI has compounded revenue and free cash flow at 9.5% and 11.7% annually, respectively. These numbers are good - but maybe not as great as you would expect from a company which has delivered such extraordinary stock price returns over the same time frame. However, there is more to the story.

MSCI has been buying back stock pretty aggressively since the share count peaked in 2012. To illustrate, free cash flow per share has delivered a 16.2% CAGR over the past decade. The numbers are similar between 2008 and today despite the 70% decrease during the global financial crisis. Since 2013, MSCI has decreased the number of shares outstanding by 34%.

I think shareholders can appreciate the opportunistic nature of the buybacks. When MSCI was arguably overvalued in 2021 (along with many others), management slowed the buybacks notably. In the third quarter of 2022, MSCI bought back more shares than it did during all of 2021. Even though you can still argue that the valuation is steep, at least it seems like management likes its stock at these prices.

(FWIW, stock-based compensation is not accounted for in the free cash flow per share numbers. SBC was ~3% of total revenues in both 2012 and 2021).

Cash Conversion

Another way to look at free cash flow is the cash conversion ratio - how much of the profits that is actually turned into cash. Some investors use EBITDA instead of net income as a way of measuring profits but net income is the more conservative approach.

MSCI’s numbers are pretty impressive and to the benefit of shareholders as MSCI mostly allocates this money to dividends and buybacks. As can be seen below, one of the reasons free cash flows are consistently higher than net income is the deferred revenue. Most of MSCI’s revenues are recurring based on subscriptions and fees from AUM (assets under management) where clients typically pay in advance of the subscription period. Per company numbers, 97% of MSCI’s revenue is recurring, and the retention rate on this subscription based business was ~94% in each of the past three years. In my opinion, the high cash conversion speaks to the quality of MSCI's earnings.

Return on Capital Employed
Prior to about 2018, MSCI’s return on capital averaged between 12-14%. Along with the index revolution (generating asset-based fees and index subscription revenue) and the global ESG push, returns have about doubled in the last few years. In my opinion, management is justified for increasing the amount of debt when it is able to create more value for shareholders by investing in attractive projects.

Valuation

If you like the financial numbers from MSCI, you probably won’t like this section so much. Investors are pricing in high free cash flow growth in the future as well, and even though it is perfectly reasonable to believe that MSCI can pull it off, there doesn’t seem to be a lot of room for error (“margin of safety”).

Some of the assumptions below could be off (I’m a rookie at DCFs/inverse DCFs), but the main takeaway is that the implied free cash flow growth at the current price is 22-23% CAGR over the next five years (almost 2.8x from $1.3B to $3.6B). If we assume that MSCI will continue to buy back shares at a similar pace, implied FCF growth is closer to 20%. Regardless - MSCI’s execution is expected to be flawless at the current valuation.

I think it is hard not to be impressed by MSCI’s financial performance. Given the industry tailwinds, the diversified products MSCI provides to a growing list of clients with more assets under management and increased need for a variety of investment products, this is only likely to continue. The question investors have to ask themselves is what price they are willing to pay for the quality MSCI offers. I remain on the sidelines for now in hopes of Mr. Market offering a more attractive price at some point.

Thanks for reading!
post mediapost mediapost mediapost media
Jorgen - Top Corner Investing
MSCI – A Track Record of Financial Execution
“Free enterprise has undergone tectonic shifts before, especially as large numbers of people moved from farms to factories in the 19th century and from factories to offices in the 20th century. The…

How did I miss this! Awesome memo sir. Appreciate you sharing it here.
Add a comment…
5 Dividend Growth Stocks to Consider & Why
This post was first published on my blog - here is the link to the original post https://topcornerinvesting.wordpress.com/2022/12/23/5-dividend-growth-stocks-to-consider-why/

Great dividend growth companies tick off a lot of the same boxes that “high-quality” companies do - typically solid balance sheets, growing free cash flows that allow the companies to increase dividend payments as well as a history of good financial performance.

The best example of this is the fact that the Dividend Aristocrats index (companies that have increased their dividends annually for at least 25 years) outperformed the S&P 500 between 2003 and 2021 (source.) The most important lesson here is that it is possible to get the best of both worlds - growing dividends as well as stock price appreciation - if you can find the right companies.

Below are 5 companies that should be in your investing universe - whether you are looking for high quality or dividend growth.

Watsco, Inc. ($WSO)
Dividend Growth CAGR (5 year) – 10.3%
Years of Dividend Growth – 9
EPS growth CAGR (10 year) – 13.3%
Payout ratio – 60%
Dividend yield – 3.5%

Watsco is a $9.9 billion market cap distributor of HVAC (heating, ventilation, air conditioning.) It is the market leader in a “boring” and fragmented industry, which Watsco is transforming through its digital experience. This will help Watsco’s customers (typically contractors) deliver parts and units faster & strengthen the relationship between supplier and contractors, a win for both parties.

Revenues have been growing mostly in the single-digits over the past decade, with the exception of 2021 with the pandemic induced boom in home spend. Even if revenue growth reverts to its mean over the next year or so, Watsco is benefitting from tailwinds such as a growing installed base (to repair and maintain), e-commerce, and the transition to cleaner and more efficient units. Add a 3.5% dividend yield to that and Watsco could be worth further consideration for dividend growth investors.

From Watsco Investor Presentation (Q3 2022)

If you want to learn more about Watsco, check out the Twitter thread from @ifb_podcast here.

Home Depot ($HD)
Dividend Growth CAGR (5 year) – 15.0%
Years of Dividend Growth – 12
EPS growth CAGR (10 year) – 11.8%
Payout ratio – ~44%
Dividend yield – 2.40%

No need to introduce The Home Depot. It’s a very resilient business that caters to both do-it-yourself customers as well as pros. Compared to Lowe's, the main competitor, Home Depot earns more revenue from pros. This tends to be more recurring and also gives Home Depot the benefit of high switching costs as these pros know and rely on the supplies and tools. However, both are great companies with scale advantages and a dominant position in the home improvement industry.

>40% ROIC over the past three years (per 2021 annual report) means that there are attractive opportunities for Home Depot to allocate capital and that management has been doing so efficiently. In addition to the dividend Home Depot has been paying a dividend for more than a decade, the company also repurchased ~$15B worth of shares in fiscal year 2021.

To learn more about Home Depot, I recommend the deep dive from The Science of Hitting (Alex Morris) and this episode from Business Breakdowns.

MSCI ($MSCI)
Dividend Growth CAGR (5 year) – 23.0%
Years of Dividend Growth – 8
EPS growth CAGR (10 year) – 18.0%
Payout ratio – 41.7%
Dividend yield – 1.06%

MSCI’s numbers tell you a lot about the quality of the company. 13% annual compound growth in free cash flow over the past 10 years and widening margins as well as double-digit dividend growth. The dividend yield is low, but MSCI has also crushed the market on a 5, 10 and 15 year basis. Recurring revenue and a capital light business model means a lot of the cash can be invested in further growth or given back to shareholders.

Taiwan Semiconductor Manufacturing ($TSM)
Dividend Growth CAGR (5 year) – 6.58%
Years of Dividend Growth – 3 (in my defense, dividend per share went from $3 in 2013 to $11 in 2021)
EPS growth CAGR (10 year) – 14.4%
Payout ratio – 44.9%
Dividend yield – 2.33%

TSM might not really count as a dividend growth company, but I wanted to include them because of the moat and exposure to the growing semiconductor industry. There’s a reason Warren Buffett recently invested in TSM. However, there are many other options in the semiconductor industry one could choose (Texas Instruments, Qualcomm, ASML, Nvidia etc.) See the overview of the chip ecosystem below.

TSM is a pure play on chip manufacturing. While this is an asset heavy company, competitors face extremely high barriers to enter because of the intangible assets that TSM has developed. If you are bullish on the semiconductor industry overall but don’t want to be exposed to as much geopolitical uncertainty, there are plenty of different ways to play this trend as well.

(Source: @long_equity on Twitter)

This memo from TSM's own Investor Relations page outlines the bull thesis

S&P Global ($SPGI)
Dividend Growth CAGR (5 year) – 12.0%
Years of Dividend Growth – >15
EPS growth CAGR (10 year) – 18.1%
Payout ratio – 26.8%
Dividend yield – 1.0%

The two credit rating agencies (S&P Global & Moody’s) are basically a duopoly with very solid competitive advantages and a product which other companies rely on. In addition to the credit rating, SPGI has several other segments such as Market Intelligence and the S&P Dow Jones Indices. These are generally stable industries that grow consistently and generate a lot of cash.

S&P Global is a dividend aristocrat and could continue to grow its dividend for many years given the large market share and strong competitive advantage. While it is a >$100B company and unlikely to provide similar returns as over the past decade (20.5% CAGR), S&P Global is a quality company.

To learn more about S&P Global, this piece from Value Investors Club is an excellent resource.

SPGI 2022 Investor Day

These are just a handful of the companies that could be included here - there is a lot of quality out there. Hopefully you got some value from this memo and maybe even a few new companies to research further!

As always, thanks for reading!
post mediapost mediapost mediapost media
www.valueinvestorsclub.com
Value Investors Club / S&P GLOBAL INC (SPGI)
Investment thesis for S&P GLOBAL INC, SPGI

Great post, great companies, thanks for sharing. 🙏. And humbled to be included in the mentions here 😃
+ 8 comments
Watchlist
Something went wrong while loading your statistics.
Please try again later.
Already have an account?