Trending Assets
Top investors this month
Trending Assets
Top investors this month
@tecantra
Michael Panebianco
$13.1M follower assets
19 following80 followers
18th September Trading Recap (and the benefits of a Play Book)
I normally only trade Wednesday, Thursday, and Friday but I do tend to look at the markets toward the end of the day for two reasons

  • to continue my narration of the market (I find it helps to read the market as an ongoing story)
  • to see if any of my setups and plays have formed so that I can pretend/imagine what I would have traded, and fantasize about what profits I could have had

And I was very glad that I have this habit.

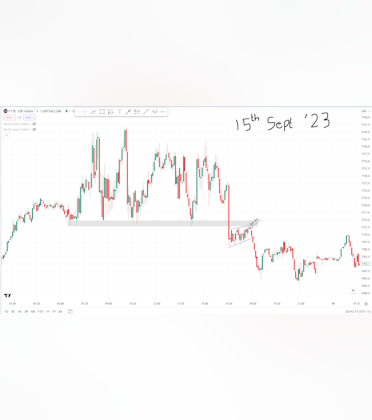
Rollback to Friday 15th

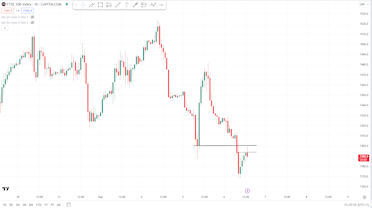
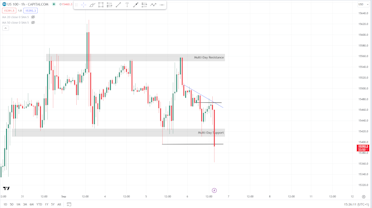
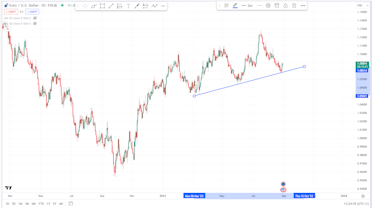
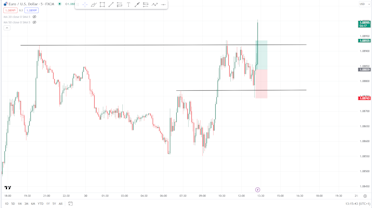
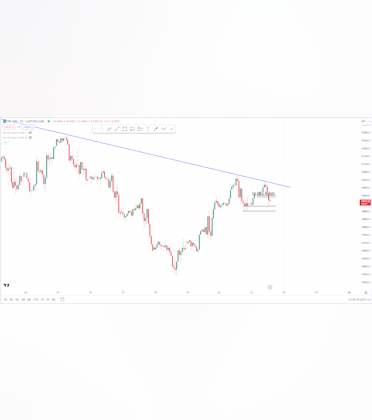
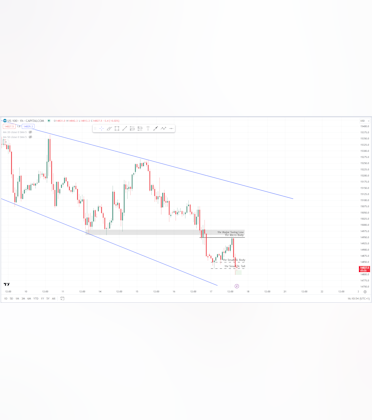
For the entirety of Friday's regular UK trading hours, the FTSE 100 was in a large range. However, right at close, the market sold off very sharply and broke through its support.
It gave a beautiful flag formation as an entry, or even the tiny Tail Bar at the retest if you were so inclined.

I'd ended my trading shortly after 3pm that day to go and pick up my boys from school so unfortunately missed that setup; I love my boys but they are simply not conducive to profits :P

Returning to present day
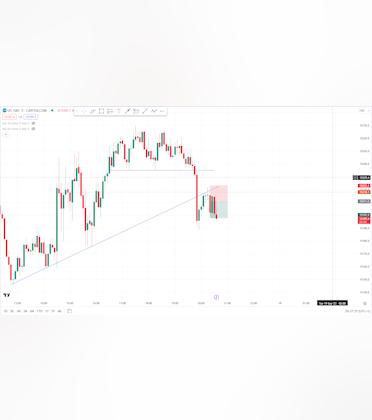
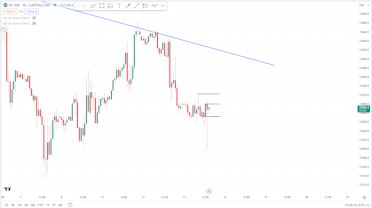
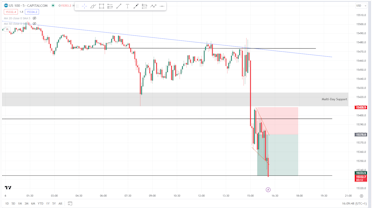
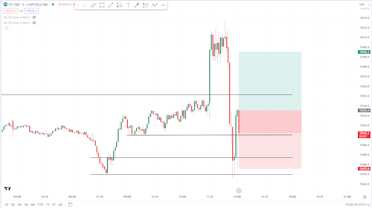
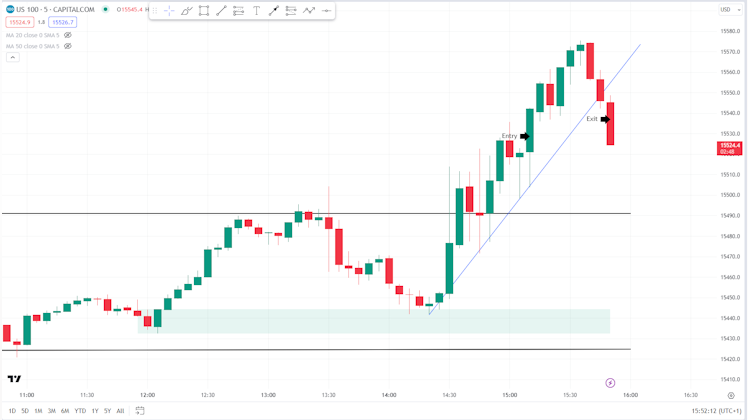
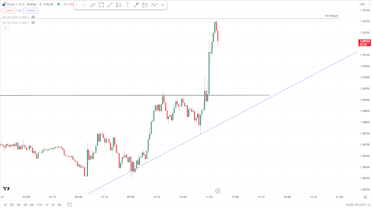
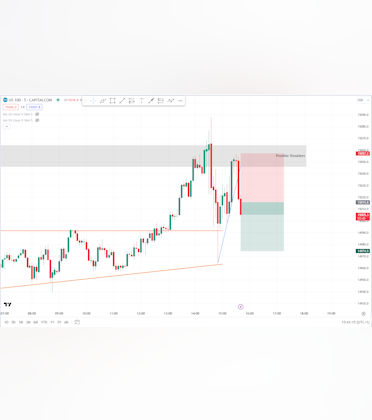
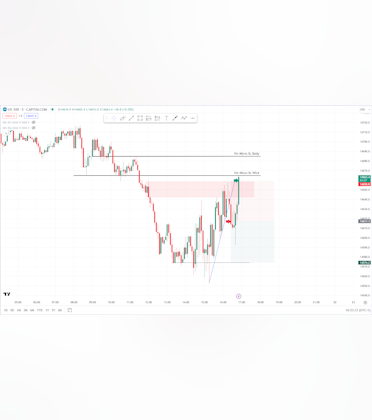
I was doing my typical non-trading day analysis and saw the exact same market play on the NASDAQ this evening.
It didn't consolidated for the entire day as the FTSE did, but 3 hours is still considerable. It was also preceded by an uptrend, broke down with volume, and showed us a very similar pull back.

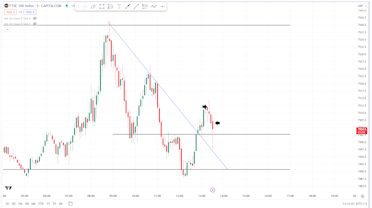
Now, the market hasn't pulled completely back to the range's/consolidation's support, but it did pull back to the next available 1hr Key Level.
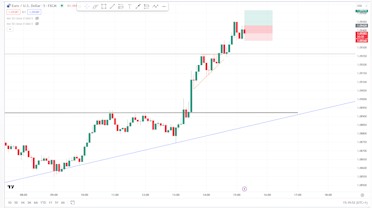
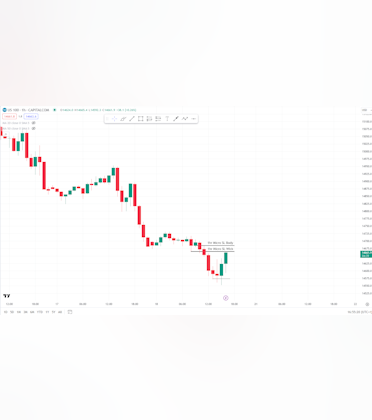
As soon as that Doji was broken to the downside, I was in and looking for a 1RR.
Normally I would look for at least a 2RR on a play such as this but there three mitigating factors:

  • market close was imminent
  • the pull back was fairly shallow (purely subjective and based on opinion/experience)
  • we were very close to a seemingly strong support area (market-open price and its earlier retest)

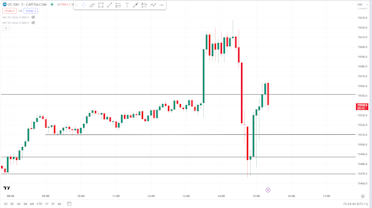
Thankfully, it worked out fairly quickly in my favour.
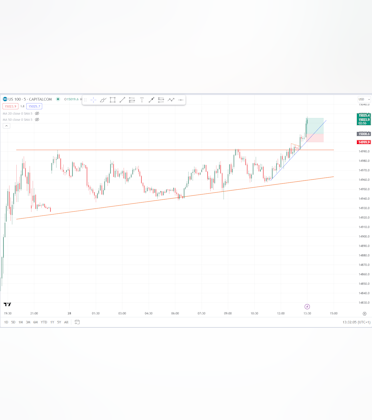
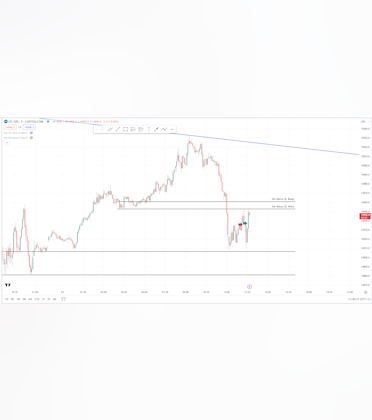
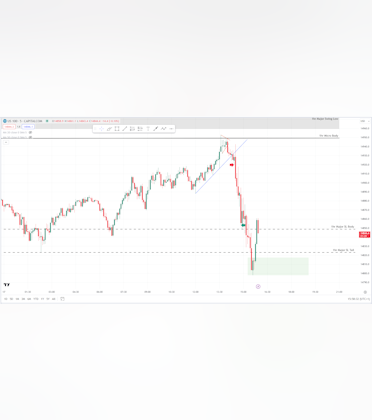
Post-Market Note
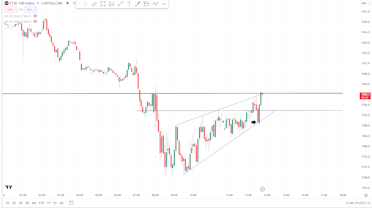
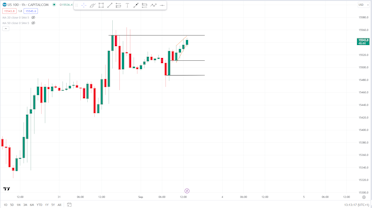
The 1RR was a solid decision. The support area really did support and as of right now (21:15 BST, 15mins after market close) price has popped right back up the consolidation.

Too late in the day for me to look for another one but if there's a convincing reaction here it will be worth recording for future reference

Play Book
If you're a sports fan, you may be familiar with a Play Book.
For those that aren't, a Play Book is selection of tried-and-tested strategies and tactics that excel in particular situations.
For example, if your opponent is employing Tactic A and you know that Tactic X has a 80% success rate against it, you go with Tactic X.

This is also the crux of successful trading.

I know, based on experience and data, that if price consolidates for as long a period as it did on Friday and today, and breaks with volume before pulling back to a 1hr key level, then the odds are in my favour and I need to be ready to pull the trigger.
Does it always work? Of course not.
But it works often enough for it to be one of my favourite plays that makes me giddy when I see it forming.

If you're new to trading, don't rush out to make a playbook; it will come naturally with time spent watching the market and analysing your past trades.
But make sure that you absolutely do make notes when you encounter situations that you recognise because they will become invaluable to your trading.
post mediapost media

13th September Trading Recap (lots of fear, and possibly a key realisation)
Trade 1

Price was in a clear downtrend and had pulled back to and consolidated around the most recent Swing Low.
Coupled with a "trendline break retest", the market conditions looked very good.

However, not visible in the 5m chart picture (but can be inferred from the 1hr) is a 1hr support area (the swing low on the 1hr chart). We will need to watch for possible reactions/reversals from this area.

When it came to entering, I was regrettably late with the Engulf execution as I was looking at the US100 chart. If my entry had been quicker/tighter, we would have had a successful 1RR. But price did indeed react at the suspected support and we were stopped for break-even (this actually marked the start of a big uptrend)

Trade 2

As noted in the previous trade, price reacted to the support and began an uptrend.
The downtrend line was broken, we were breaking swings and making new highs.

The key level used for this trade was the 5m micro-swing just outside the downtrend, and the trigger was the break of the Tail Bar. Unfortunately, this possible support was strong to protect from US news and US pre-market open - I certainly should have been aware of these factors.

The candle that stopped me out actually provided another signal at a stronger key level (1hr swing). But there was still some recoil from the failed trade and I didn't take it out of fear. I had I done so, that would have been a clear 2:1 winner - recouping my losses and putting money in the bank.

Stop letting failed-trade-fear prevent you from taking the next trade. This has happened several times before.

Trade 3

I took this Tail Bar at a 1hr Key Level believing that the sell off from pre-market news was a sign of things to come around open.
I thought that the sell-off was the real intent of the market and that price was filling a liquidity gap and was searching to fill more orders.

I was very wrong though!

Trade 4

I recall becoming frustrated and impatient because I had missed an opportunity to go long shortly after 15:00 when price had returned to the pre-market open price.

Despite feeling that way, I'm still quite content with the reason for this next trade. The break of the consolidation trap at resistance was a good move BUT I was quite late on the entry…and I don't know why.

Because of my lateness, we have to overcome that resistance to hit a 1RR. If the entry was sharper, we'd be quite a bit below it.

Out for Break Even on this one. Price started struggling around the resistance and looked like a H&S was forming on the 5m. Price was also flirting with breaking a 5m trend line.

Personal Note: good call. Would have been stopped for another loss had I not clocked the reversal signs.

Trade 5

My favourite trade of the day in regard to the confluence lining up.

At 15:00, price had reached a resistance area that had survived a barrage of touches since the week
began. A nice looking Tail Bar was formed but I wanted more than just a candle here; the uptrend was strong and I wanted a clear reversal sign.

Price ended up selling off very sharply, showing a clear supply area around the resistance. It also broke the uptrend line with conviction.

Price corrected back up to that supply area. The ideal entry here would have been a Limit Order but my confidence had been shaken from the rest of the day's trades, and I was certainly living in fear right here.

My entry was the break of the solid candle, with the Stop Loss at the top of the supply area. This also began to show the beginning of a Double-Top, so another reason to go short.
In hindsight, that was probably far too wide a Stop Loss for a candle entry. Perfect as a Limit Order stop, but perhaps too much for the a candlestick.

My initial profit target was the most recent swing low but was happy (and hopeful) of a return to support.

In the end, I closed manually for 1.5RR at the second black arrow. Price had been consolidating just above the previous low, and although it was making new lows
it was struggling to close below them. Most recent candle had just been shy of touching it before seeming to reject it.

While I could have had the whole lot if I had simply let it ride, I don't think that would have been the right thing to do.
  1. We were rejecting from an area of support
  2. Candles were printing new lows but "couldn't close"
  3. Time of day

The time of day was an important one. Not only because UK market had closed and this was post-market trading, but my boys were back home and I wanted to go play! :D
The point of my trading is to free up my time to do exactly this sort of thing!

End of Day notes
There was only a single day in August that I took more than 1 trade, and even then it was only 2 trades.
This is my 5th trading day of September and my trade counts are 3, 3, 4, 3, 5 There is still half
the month to go but, as it stands, it looks like I will struggle to match August's profitability.

At the end of this month, compare the quality of August's setups to those you took this month.
Were all of September's trades good quality?

If they are, then fair enough. But if not, consider reviewing your criteria for entering a trade.

More trades does not always equal more profit.

Should I consider only taking 1 trade each market for the rest of the month? HA! That comment had made me go and check…with the exception of just 1 trade, all trades were made on the US100.
This month has seen attention split equally between US100 and UK100. Is this one of the causes?
Let's get a bigger sample size (at least until the end of the month) and see how it goes.
I've added a note to my EOM Recap to remind me to explore this.
post mediapost mediapost mediapost media

6th September Trading Recap - daily profit marred by emotion
Trade 1 of 3

Throughout the morning, it looked as though the UK100 was correcting back up to a 1hr Major Swing which I suspected would act as resistance.

The nature of the price action looked good to me, and upon reaching the major swing, two rejection bars were formed. The bars themselves seemed fairly small and so I waited for a little more confirmation. Immediately after, a strong bearish solid bar was formed and I got in short.

Unfortunately, I was stopped out almost immediately (this was actually the precursor to a very strong bull run).

I don't think my analysis of the market structure was particularly wrong. A less aggressive trader may argue that I should have waited for the trendline to be fully broken before entering, and they would not have been stopped out.
For me though, I'm content with my analysis and reasoning here and am chalking this up as a "normal loss".

Trade 2 of 3

There was a plethora of significant US economic reports and news releases today. It seems that the 15:00 releases are those that did the damage, and price sold off sharply below a week-long resistance that had been respected up to 6 times previously (depending on whether or not you count the retests).

There was a sharp and sudden retest of the support, culminating in what I would term an "Exhaustion Bar" (the big solid deceptively bullish bar). Immediately
after this Exhaustion Bar we had a nice solid bearish bar suggesting a continuation of the sell-off, and I used this to get in.

My price target was the next suspected support, and this gained me a 1.5RR. At my PT, price decided it would be fun to tease me, letting my PT sit inside the spread (Bid was below PT, Ask was above) before seemingly starting to reject. The trade was ultimately closed for 1.35RR.

If I had held my nerve, my original PT would have been hit…and then some. There's no chance I would have held for the entire 2.5RR that the market offered (strategy would have compelled me to close earlier), but I wonder if I would have been so quick to manually close had I not suffered the earlier loss.

Trade 3 of 3

This trade has left me bitter - I closed for Break Even too early when, had I left it alone, it would have been another winner.
I know exactly why I closed early. After suffering the loss with the first trade of the day, I was so relieved for the second trade to be a winner that recouped my losses and put money in the bank. But it was a slim profit, and a loss on this third trade would have meant a losing day, despite all of my efforts and my perceived "comeback".
This is a terrible way to approach the markets and day trading. Each trade should be taken and managed on its own merit, regardless of what the day, week, month, last trade, last two trades etc. have brought you.

The setup for the trade itself was very nice indeed. You can see how an inverse Head and Shoulders was formed at the same support that I used for my earlier trade's
profit target. At the right shoulder, price consolidated for little over an hour before popping up nicely and giving us a higher high, strengthening the possibility of a market reversal. I set a Buy Limit at the top of the consolidation with my Stop Loss below it. The price target was a modest 1:1 as the market was closing soon and
it was very late in the evening for me.

Despite falling much deeper into the consolidation than was comfortable, price began to rise again. However, at the swing high, we saw a lot of buying pressure, with the 5m candle engulfing the previous candle and whipsawing about. I got spooked and closed for Break Even.

The very next f***ing candle took price to my PT.

I would like to say "lesson learned - I'll never let my emotions dictate my trading ever again". I think everyone here can attest to just how much more easily that
is said than done.
post mediapost mediapost mediapost media

1st September Trading Recap (and August reflections)
Pre-Market Analysis

Price looks to be consolidating within an upwards wedge to a resistance which price had rejected from several times yesterday.

Non-farm payroll is due at pre-market open (15 minutes from now) and that could cause a substantial move.

No clear picture just yet - will definitely need to see the result of NFP release before creating any ideas.

Market Open

NFP did cause a reaction but Market Open completely reversed it and took it back to UK Open prices.

The drop was so sharp that I expect that there was some sort of liquidity gap and there may be further orders needing to be filled at the consolidation.

The Tail Bar at Support/UK Open was not enough to indicate a reversal and so I waited for additional confirmation. I am long after the larger Tail Bar/Engulf Candle.

I need to be mindful of the 1hr Resistance directly above.

Price did indeed begin to reject from the resistance so I was out for Break Even.

Price came back to the support again. Price briefly consolidated at this support (which I like to see) and within this consolidation there was a 1-2-3 formation.
The pop up form consolidation was convincing and I entered once the consolidation's high was broken.

However, somehow I managed to overlook the main downtrend. I don't know if I would have shorted into that support but I feel as though I should have waited for the downtrend to be absolutely cancelled before considering any longs.

Today, I feel as though I completely misread the market. I was heavily distracted once more by my 9-5 and also personal life circumstances (which I'll cover in the recap).

August Recap
Despite a choppy week this week, August has been quite successful and rather positive. But you can see simply from the quality of analysis how things started to trail off in the final week.
I love my kids, but I'm so thankful that this week is the final week of the summer break - back to school next week!!! Their cousin was visiting and there was illness throughout, resulting in poor sleep and sluggishness.
Hoping to feel refreshed and much more patient and clear-thinking come Wednesday next week.
post mediapost mediapost mediapost media

31st August Trading Recap
5m Price consolidated around a 1hr Resistance. It was a choppy consolidation, but looked like consolidation nonetheless.

Price broke out of the consolidation and beyond the resistance before pulling back into the consolidation and to a 5m uptrend line.

Price formed a bullish tail bar which I used to get in with. I was a little later than normal with my entry as I wanted a little more confirmation given the choppy nature of the market so far today. However, this will seriously reduce my RRR.

Price acted out a stairstep pattern so I trailed the lows with my Stop Loss.

Price went as high as 1.5RRR before coming and ultimately giving a little more than Break Even. Given that it wasn't a breakout play, would a committed 1.5 or 1 RRR have been better?
post media

30th August Trading Recap
The Daily and 1hr Charts show EURUSD in an uptrend, and we look to bouncing from
the trend support. Bias is on longs.

Rushed the EUR trade without properly looking at the 1hr Chart or zooming out on the 5m chart. FOMO
without proper preparation, and heavily distracted by the boys. As a result, I didn't see that a resistance
had been rejected twice and that we were quite close to it.

5m chart showed clear buying pressure at UK Open followed by a deep correction.
After the correction, price shot up strongly before starting another correction.
Upon reaching the previous Swing High, there was still clear buying pressure and a big bullish
bar formed which I used to get in.

Once I realised my FOMO, SL was immediately moved to break even and TP adjusted to 1:1 (which
coincided with the resistance area).

Frustrating, as I could have had a lot more here. Had I been focusing and concentrating,
considering the 1hr and 5m charts properly, I believe I could have had the meat of this move.

The move down from resistance was a textbook example of a correction and there was no clear
selling pressure. This movement would also have fallen into the "Consolidation Trap at Resistance" setup.

Letting my emotions get the better of me now. Frustrations of closing the previous trade go too early coupled with distractions from my 9-5
were precursors to this trade.

The rationale for the trade was that we have continued up and are bouncing from 5m Micro Levels.
We formed and broke a bullish bar at the most recent 5m Micro Level.

This trade failed very quickly. Considering commissions involved, small but real net loss for the
day.
post mediapost mediapost mediapost media

28th August Trading Recap
Price broke out of a 1hr consolidation around 1pm.

There was some consolidation before the breakout which maybe I could have taken. But the key setup that I really should have taken, but didn't because of fear, was the consolidation after the breakout which I tracked.

On open, price was at a possible 1hr H&S level and sold off to the bottom of the 1hr
consolidation. Note that it didn't break the low so we are still technically in an uptrend.

Price came back to the sell-off level with a correction-style movement and began to consolidate, indicating that bullish
momentum was weakening. We then sharply sold off from the 1hr resistance, the 5m consolidation, and broke the 5m
trend line with conviction I got in once the big bearish bar was broken.

There needed to be a lot of caution here though as the 1hr consolidation could provide support and the uptrend is still
intact (despite the new lower high).

Price began to reject from the bottom of the 1hr Consolidation so I closed for a 1:1.
post mediapost media

23rd August Trading Recap
WARNING - It's Wednesday, so oil stocks report due at 15:30. Also PMI reports at 14:45

On the 1hr Chart, price has made a double-top along the same 1hr downtrend line show in the 17th August. So I'll be looking for shorts.

There is a clear support area, shown by the 2 bottom-most black lines, and so I need to be very mindful of rejections from here.

Clear selling over the past several hours and price is currently pulling back. The first two key area is the marked 1hr Micro Swing.

Moving down to the 5m chart and the current pullback looks textbook. Price reached the 1hr Micro SL Wick and produced a bearish engulfing bar which I used to enter.

Price continued down to the support area so I moved my SL to break even - price bounced and I'm out for break even.

This marked the end of my trading today (due to personal life commitments), but the markets still had some interesting activity...

Further Activity
Every Wednesday sees the EIA Crude Oil Stocks report. The markets can often be quiet leading up to this release, and it can cause some significant volatility when it's announced. We also had the PMI reports today, and these can really shift markets. The PMI reports were released at 14:45 BST, where the black arrow points to.

Price broke upwards out of the 3-week downtrend with conviction, presenting 3 aggressive* setups along the way.

*aggressive by my standards and strategy.
post mediapost media

18th August Trading Recap
Today, price fell throughout the UK session and there was no clear 1hr Breakout.
The only 1hr Key Level available for use was the 1hr Micro Swing.

Moving down into the 5m Chart, there looks to be a Supply Area (shown by the red box) just below the 1hr Micro Wick.
It was around these areas that I would look for price to react.

As we approached the Supply Area we started to see some rejections. But the market is very choppy so I wanted some more confirmation.

Price eventually broke the 5m uptrend line with conviction and I entered short (shown by the red arrow).

Because the market is incredibly choppy today I have opted for a simple 1:1.

Unfortunately, price shot up and hit my Stop Loss.
post mediapost media

Dang— I see what you were trying to do, I would have guessed that downtrend would continue too. Crazy that it reversed upwards pretty much immediately when you entered short. Oh well. Thanks for the update!
+ 1 comment
17th August Trading Recap
Since 15th August,
NAS100 has very clearly been in a downswing.

From the early hours
(BST) of the 17th August until pre-market open, price was correcting back up to
a 1hr Micro Swing, which coincided with the most recent 1hr Major Swing Low. I
would expect to see a reaction here and so I moved down to the 5m chart.

On the 5m chart, I
first noticed the fairly well-defined uptrend line (blue) and was keen to watch
for this to broken near to my 1hr levels.

As pre-market
opened, price had reached the suspected resistances and began to consolidate
(shown by the orange lines), showing us that bullish momentum was waning.

Price broke down
from the consolidation and also through the uptrend line. Great stuff! I then
wanted to see some sort of pullback to and retest of the consolidation and/or
resistances.

At market open,
price moved back up to retest the prices at consolidation before shooting back
and engulfing the previous candle - this was my final signal to get in short. I
was sharp with my entry today, getting in almost exactly at the red arrow.

My profit target was
the 1hr Small SL (Swing Low) Body shown by the closest dashed line. The
justification for this profit target was that price had rejected this area 3
times prior and so some support should be expected. My Buy Limit was triggered
at around the green arrow, for a profit of approximately 2.76R.
post mediapost media

Watchlist
Something went wrong while loading your statistics.
Please try again later.
Already have an account?