Trending Assets
Top investors this month
Trending Assets
Top investors this month
$13.1MFollowers
17th August Trading Recap
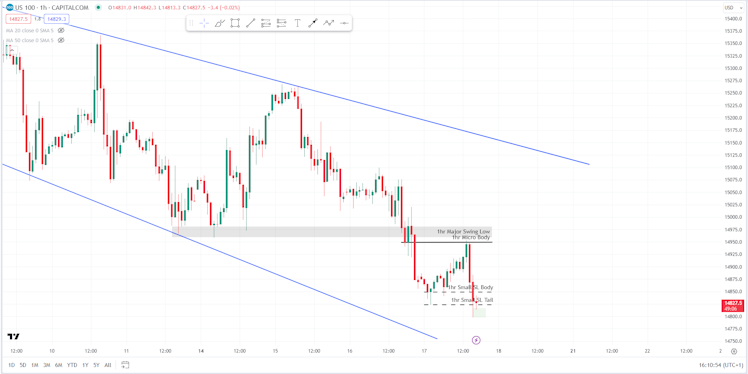
Since 15th August,
NAS100 has very clearly been in a downswing.
From the early hours
(BST) of the 17th August until pre-market open, price was correcting back up to
a 1hr Micro Swing, which coincided with the most recent 1hr Major Swing Low. I
would expect to see a reaction here and so I moved down to the 5m chart.
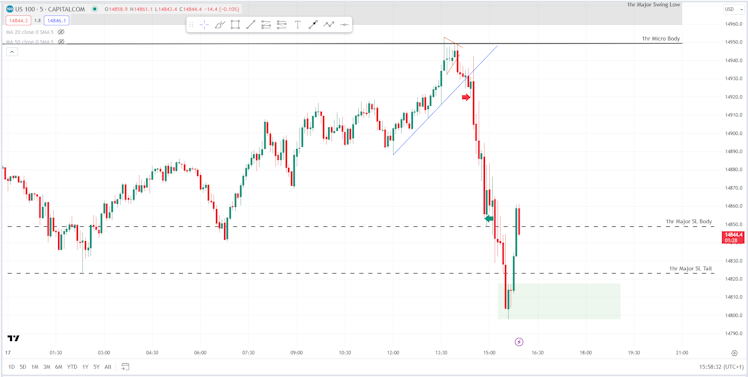
On the 5m chart, I
first noticed the fairly well-defined uptrend line (blue) and was keen to watch
for this to broken near to my 1hr levels.
As pre-market
opened, price had reached the suspected resistances and began to consolidate
(shown by the orange lines), showing us that bullish momentum was waning.
Price broke down
from the consolidation and also through the uptrend line. Great stuff! I then
wanted to see some sort of pullback to and retest of the consolidation and/or
resistances.
At market open,
price moved back up to retest the prices at consolidation before shooting back
and engulfing the previous candle - this was my final signal to get in short. I
was sharp with my entry today, getting in almost exactly at the red arrow.
My profit target was
the 1hr Small SL (Swing Low) Body shown by the closest dashed line. The
justification for this profit target was that price had rejected this area 3
times prior and so some support should be expected. My Buy Limit was triggered
at around the green arrow, for a profit of approximately 2.76R.
Already have an account?