Trending Assets
Top investors this month
Trending Assets
Top investors this month
@stayvigilant
Rich Excell
$11.6M follower assets
116 following571 followers
Chart of the Day - investor mindset.
Over the past few days I have had conversations with a number of people on a range of investing topics - why is the Ethereum Merge a non-event, should I move my 401k into cash, are private mkts the next shoe to drop, why is implied volatility not reacting to the move
lower. All have different portfolios & risk tolerance. However, there was a similarity in the questions. When it comes to money, people are always happy when it is growing, nervous when it is shrinking (even if just giving back profits) and panicking when it collapses.

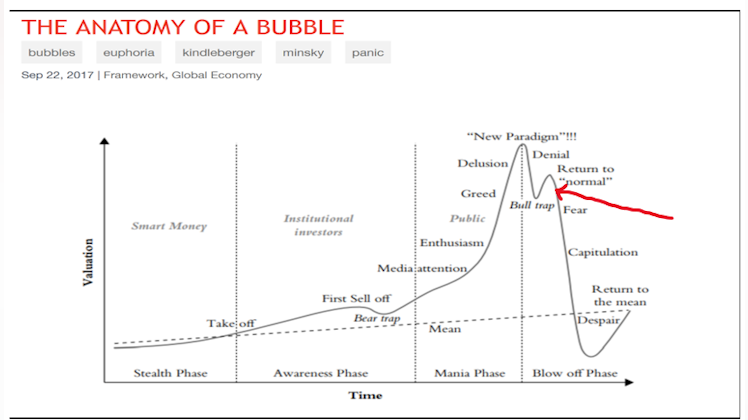
Even in a world of systematic/robotic/algorithmic portfolios there are behavioral biases. The end allocator drives the decision. The fund just executes. It may take longer to react but the path is similar. It follows the chart I have on today. As you look at it, ask yourself,
where am I on this?

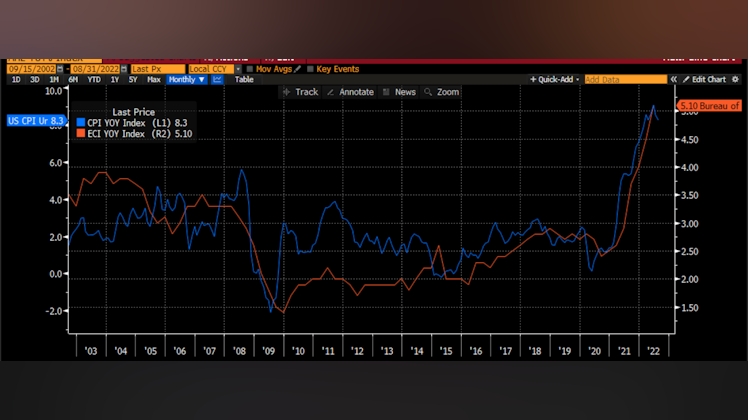
The obvious place to start is high growth tech investors. I know in fall of 2021 we were at the New Paradigm phase. Spring 2022 was the denial phase. I think we are solidly in capitulation now. I base this a lot on many conversations with students who a year ago thought value investing and old economy companies were dead to never come back. Now they are pretty bearish overall.

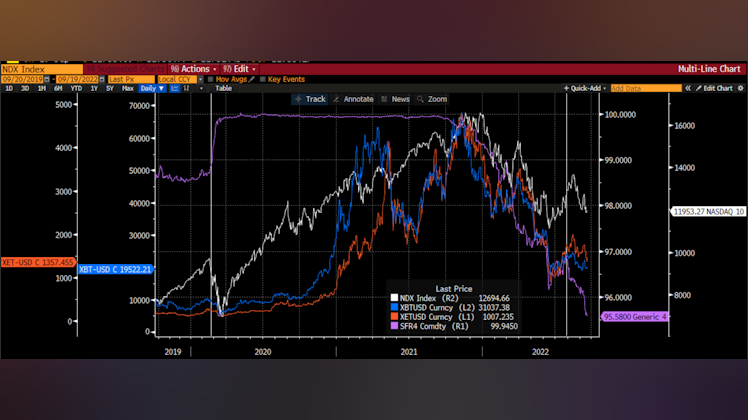
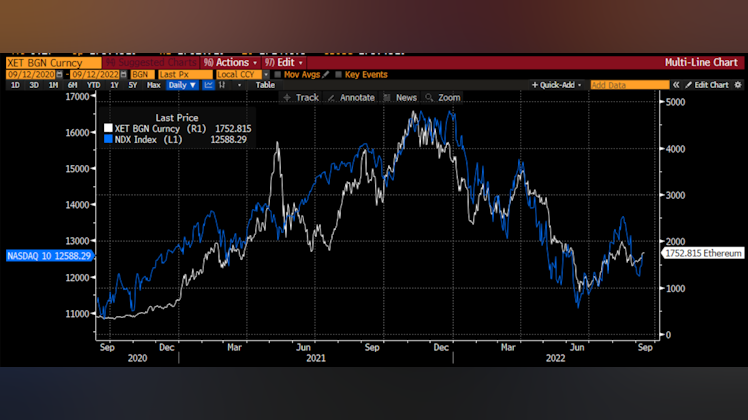
Another place to consider is crypto. When had a major catalyst last week with The Merge. Ether rallied well before, came off some and then tried to rally back. It is heading back lower now. I might argue it is where the red line is. Bitcoin has gone through this bubble diagram twice now. Remember the crypto winter? Are we going back? We now have infighting
between the Ethereum network fans and the Bitcoin maximalists. Uh oh.

More concerning is the move in risk parity portfolios. Early last year, I said the move higher in inflation, which was not transitory, would break these portfolios that relied on negative correlations. With inflation, the major assets are positively correlated. This is the land of
institutions primarily. If we are in a world of permanently higher inflation, where are risk parity investors on this diagram? How much they pivot for the next 10years? Maybe not at the red line yet but still in the bull trap area waiting for the return to normal.

Not to be left out are the traditional 60-40 retail investors. Whether this is done with an advisor or via a target date fund in the 401k, your portfolios is off to the worst start in your career. I know that because 60-40 is off to the worst start since the Great Depression in 1930.
These decisions take long to make but how will retail investors react when they get their Sept quarterly statement. Or the year end statement? Where are they? Probably still in denial would be my guess.

Of course, we do not have to follow this path. It is just that we usually do. I am open to what can change that. However, for now, given the conversations I have had, it is time to ...

Stay Vigilant
post media

Chart of the Day - rates, camera, action!
The big event this week will be the FOMC meeting tomorrow. Not that the Fed is the only game in town, though in a dollarized global economy, right now it is the biggest game in town. Global central banks have been hiking short rates even if we have seen some policy easing in places like China. Those moves aside, the move by the Fed tomorrow & importantly the commentary on future moves, will be the trigger for risky assets for the next month+

The knee jerk reaction by many algos is to buy stocks ahead of the FOMC meeting. The Fed itself has put out studies about the positive drift into FOMC meetings. Presumably this is due to the perceived potential for dovishness. Perhaps, that is what took us higher yesterday. However, it would seem naive to think the Fed will be dovish in light of the comments after the July mtg, the August Jackson Hole, and the data we have seen.

The chart today shows the impact of rates on the other risky asset. For rates I have chosen the generic 4th contract of the SOFR futures which looks out 1 yr from now. So not just near term rate moves but the expectation of where they are going & staying. The risky assets I have chosen are those near & dear to all - Nasdaq, Bitcoin & Ether.

We can see on the far left, back in Covid times, the 12 month ahead futures rallied aggressively indicating rates were going lower quickly and staying there for some time. With a small lag, these long duration, risky assets were off to the races, led by stocks but ultimately surpassed by crypto.

This all started to peak in late 2021 when the rates in purple started to move lower. The risky assets followed suit, about a month later again and proceeded to move lower until the summer. At that time, the futures bounced a but as did risky assets.

The line on the right shows when the futures turned back lower in late July. a few weeks later the risky assets followed suit. These assets are clearly following the path of rates right now. This path has moved lower and begun to accelerate. It is well below the June lows. Will this continue? We will find out more about the path of rates in tomorrow's meeting & press conference.

This week will be all about rates. The path of forward rates will dictate the path of risky assets. It is time for rates, camera, action!

Stay Vigilant
post media

Chart of the Day - dashed hope.
Last night I watched the Bears lose to the Packers yet another time. Leading up to the game, logic said there was little chance the Bears would win in spite of winning their first game. However, there was still some hope because the Packers looked really poor in week 1. That hope was quickly dashed as the game was over by halftime. Even when there was a late effort to get back in, that hope was dashed too.

This feels like a week set up for dashed hope in the mkts as well. Logic says the mkt needs to move lower. The economic data is pointing in that direction. Equities are the only thing that are not at the June lows as rates, crypto and even commodities are back to those June levels. However, there is some hope. Positioning is very bearish after all. This could change on a dime if the news flow gets better. This hope looks set to be dashed this week with the events that will play out.

This week is chock full of housing data. I show in the top graph the NAHB number, building permits, new home sales & existing home sales. All are pointing lower, at some pre-Covid level. This could be normalization from the Covid boom, or it could be more than that. We will soon find out with all of this coming out today. Anecdotally, in the Chicago suburbs, I still see houses being built & houses selling. This is nothing like late 2020/early 2021 but it is far better than pre-Covid. Perhaps that means there is more downside or perhaps it means places where prices didn't go crazy are still okay.

The bottom chart shows the spread between the 30yr mortgage rate & the 10yr Treasury. It is more than 2 standard deviations wide, levels hit during Covid and the GFC. This will come lower. It is a sign that lenders are nervous & don't want to lend right now. It is a sign that velocity is low & credit creation is not happening. It is actually a sign of hope once we get through this period. We will also hear from the Fed this week. That has the possibility of dashing this hope tho.

If we look at a blend of the mortgage rate & the unemployment rate, as the decision to buy a house is a function of the monthly cost but also whether someone has a stable job, it does not look bad at all. That rate (not shown) peaked at 7% in the GFC & Covid. It is below the 5% average of the last 20 years now. That suggests housing could be okay. Another sign of hope going forward.

HOPE is also the acronym for housing ->orders -> profits -> employment, the direction money flows into and out of the economy. We have seen the first two weaken. The expectation is the third will weaken over the coming month. When will the last one weaken? Will this be another sign of dashed hope?

The mkt is moving lower because of dashed hope. Bears fans are upset this morning because of dashed hope. I think you can blame the bear mkt on Aaron Rodgers. Blaming him for problems works really well for me. Give it a try.

Stay Vigilant
post media

Latest Stay Vigilant blog is out!
stayvigilant.substack.com
It's a critical juncture
There has been a lot for investors to digest since coming back from the summer, and there is more to come. Now may be the most important time of the year for portfolios.

This is an excellent analysis and gives me insight into your position. Thanks for sharing your work Rich!


I like being aware of what’s going on from a macro perspective, but I’d think it's best to never let it scare one out of the market or into all cash. However, I am speaking from the POV of a passive investor who does not enjoy timing the market.
Add a comment…
Chart of the Day - twin peaks.
This week I was fortunate to host two podcasts with people I have known for a long time & for whom I have a lot of respect. They each bring a very unique view for how to navigate markets, especially difficult markets. They each can cut right to the heart of what is most important to determine on both the reward side of investing & on the risk side of investing. After all, every investment has a reward & a risk & it is our job to weigh our options comparing each. Each of
these, in separate conversations, referred to the idea of twin peaks.

The twin peaks that they referred to that the market needs to see before investors of any asset will feel comfortable to take risk are the peaks in Fed Funds rate (in blue) & the peak in inflation (in white). We have seen this playing out over the course of the summer & so it
should not come as a surprise to us.

I use the SPX Index in orange as the proxy for the risky mkt. You can see that the market
bottomed over the summer when the expectation for Fed hikes (in purple - hikes over next 1 yr) was falling. This coincided with the peak in inflation on a year over year basis back in June. This gave rise to the discussion of a Fed pivot & the bond mkt started to price rate CUTS
into the 2023 curve. Stocks liked this. We rallied 20% from the lows. However, what caused this rally to stall?

The stall came from the Fed commentary, after both the July FOMC but also during the Jackson Hole Symposium, that the Fed is not done. There is no peak in Fed Funds.
We see the purple line start to move back higher & stocks sell off. Then we get the tick higher in CPI this week - not large from 8.1 to 8.3 - and the bond mkt realizes even further that the Fed is not done. 1.5 more hikes are priced into the Fed Funds. Stocks have a big move
lower on Tuesday & have continued.

You see, for a bottom to be in, a necessary pre-condition, perhaps not the only condition, is for us to see the twin peaks - the peaks in inflation & the peak in Fed Funds i.e. for the Fed to at least pause. Until then, we are in a volatile mkt with a downward bias.

Since it is the weekend & we are discussing peaks I thought I would end by passing on some other advice. As you watch your favorite sports this weekend, consider perhaps Four Peaks, a terrific beer brewed out in Tempe, AZ. If beer is not your thing, there is Six Peaks winery which makes a nice Pinot in Hillsboro, OR. Finally, for those in the intl audience, that want something different, try Eight Peaks (Hakkaisan), a lighter style junmai sake that comes from the Hakkai Mountains in Niigata, Japan. Even as you enjoy, remember to ...

Stay Vigilant
post media

Chart of the Day - whew!
As I drove down to Champaign this morning, I heard on the radio that the railroads & the unions had reached a tentative deal to avoid a strike. This had been the subject of discussion in the family of late, because there were thoughts to take the Amtrak to St. Louis for a
wedding instead of driving. When the risk of a strike was looming, driving was decided & as of last night, it seemed pretty prudent. Probably still is today as many services were canceled. Whew! Dodged that headache.

However, it isn't just Amtrak. In fact, it is mostly not Amtrak that was affected. Rail freight makes up about 27% of the freight moved in the US, second to trucks. In a story yesterday, the head of the national truckers association was asked if the truckers could pick up the extra freight in case of a protracted shutdown and he said we would need an incremental 500k trucks on the road. Hmm. Even if we could get drivers, that would seem to clog up a fair bit. Perhaps this is why rail freight has been holding strong and retailers building inventory, not because they can't sell it, but because they wanted redundancy in the case of a strike.

You see, the railroad unions are not the only ones in labor negotiations. Just staying on the
freight theme, we know the truckers in California as well as the stevedores that unload the docks are also having discussions now and a strike is possible in early Q4, right before holiday shipping. So there are more potential hiccups down the road.

It looks like the union agreed to a 24% raise over the next 5 years which includes an
immediate 14.1% raise paid in $1k installments. Seems generous but also necessary given the inflation we have seen. Do you think the truckers and the stevedores know what the railroad workers got? How about the Amazon employees that are trying to decide if they should unionize or not. Or the auto workers. Or the service employees unions. Or the teachers.

This will have ripple effects for many months to come. The chart today shows the Employment cost index vs. the CPI on a year over year basis. It has directionally kept up but not in magnitude. While inflation is up 8.3%, employment costs are up 5.1%. However, that
number is clearly going to rise. What do we think that rise in wages will do to corporate margins and therefore earnings? What do we think company commentary will be on that? Do we think they will be saying Whew?

As I have said many times before, inflation is more than just a number, it is a mindset. This is why the Fed is using jawboning & fwd guidance to convince us all that inflation WILL come lower. They will need to back this up with aggressive rate hikes at the next two meetings at least. As I tell my students, we do not know when a forest fire will start, but we can tell when the conditions are such that a fire could begin.

Stay Vigilant
post media

Chart of the day - surprises part 2.
Was in class all day yesterday and so I could only see the results of the mkt move after the close. It was a bit of a surprise, not in the direction because we spoke about that in the
morning, but in the magnitude. I read one person on Twitter referred to it as a 4 s.d. move, looked more like a little over 3 s.d. to me but I don't want to pick nits. Moves like that should happen about once every 3 years. You might wonder why something like that happens on a CPI number but it does show you that inflation & the Fed are the biggest game in town.

Though it isn't the only game in town. In my work, I like to look at both inflation & growth to determine which phase of the economy we are in. Going into this number, over the previous 1-2 months, the mkt was pricing in falling growth & falling inflation. Yesterday, amidst the noise, it moved to price in still falling growth but rising inflation. I determine this from the sector & style moves I see in the mkts.

What do we know about growth? We know the latest reading of the ISM came in better than expected. Some might wonder if growth is even going to fall. However, the ratio of new orders
to inventories (in orange) has plummeted & that usually points to weaker growth ahead. Historically back to 1947, the ISM takes anywhere from 15-24 months from peak to trough. It peaked in March of 2021 which might suggest a trough sometime in late Q4 or early Q1. Where it troughs is the bigger question.

Importantly, as we are about to begin #earnings season, we can see that the ISM in white is coincident with the % of positive surprises we see from companies. If ISM is still expected to go lower, earnings are still expected to go lower. You can see in the bottom chart (courtesy of CS) that consensus earnings expectations for Q3 are considerably below the path taken last qtr. The mkt sees the ISM falling & is expecting some amount of this fall in earnings surprises.

The bad news is we know multiples are going to contract as long as the Fed is hiking as we looked at yesterday. If earnings are falling too, this paints a bleak picture over the course of
the next few months. Yes, we can rely on positioning that is quite bearish. However, leverage was not maxed out so there is more that could happen. Additionally, since a large part of the mkt is passive or systematic, the reactions from these players has most likely not happened yet.

The temptation on big drawdowns in the mkt is to look for bargains. It might be a little early to do so with the possibility of more surprises - from earnings or from the magnitude of the moves we are seeing. Now is a time to ...

Stay Vigilant
post media
LinkedIn
LinkedIn Login, Sign in | LinkedIn
Login to LinkedIn to keep in touch with people you know, share ideas, and build your career.

Chart of the Day - surprises.
Last night the family went out to dinner at our favorite sushi place in town. Insert the joke here about getting sushi on a Monday night, but it was a special occasion & it is our favorite place. Surprisingly, it was hopping last night. Packed. We were lucky to get a table for the 5 of us. Bear in mind, there was no sporting event to watch for Chicagoans. The weather was 'meh' so that wasn't an excuse. I thought to myself that maybe this economy, or at least my corner of
it, is in much better shape than I am giving it credit for.

I guess I shouldn't be surprised then that the CPI number today was also a surprise - surprisingly hot. I was expecting a weaker than expected number given what we have seen in commodity prices, M2 growth, fincl conditions & inflation expectations. However, it was stronger & stronger across the board. It was hard to find a category that was down.
Shelter led the way as rents are hot, & medical care costs were next. Everything was higher than expected as was the core.

This brings the Fed solidly in play. I will say that even though I expected CPI to be lower, I still thought the Fed had to hike 75 bps. I think the Fed is fighting not just the inflation number but the inflation mindset. I think the Fed wants to restore credibility in its resolve. I think JayPo wants to normalize policy, which he did in 2019 & the mkt wouldn't let him but now he has the green light. So 75 bps is a lock in 8 days now with tiny odds of 100. It looks like 75 bps is starting to be priced into Nov. I thought that was also going to be 75 even with CPI easing so I am even more convinced now.

This is not good for equity prices. The chart today shows the number of hikes priced into
the next 12 months in white & the forward EV/EBITDA multiple in purple.The driver of the mkt has been multiple expansion from the very lows in June as rate hikes were being priced out & some rate cuts were priced in. As the rate cuts came out, multiples declined and that
was the end of August sell-off. With today's news, there is little reason to think we will not go back to the lows in multiples. That means earnings will have to carry the mkt exactly at the time when earnings are expected to slow. This does not paint a pretty picture for mkts.
This is at a seasonally difficult time for risky assets. This is at a critical time in Europe & Asia. The risk antennae are on high alert.

I have written about the need for a catalyst to change the impasse we were at with negative news but also negative positioning. Position sizes were smaller now & there would seem to be clarity to press bets. I fully expect the bears to control the tape for the time being. Be careful out there and ...

Stay Vigilant
post media

Great timely update. 75 bps does look like its starting to be priced in for November. I'm enjoying listening to the @contrarianmedia podcast you did right now about this topic!
+ 2 comments
Chart of the Day - The Merge
This weekend we were glad to host my daughter Lauren Excell & her friends that are all alumni of the The Hoeft Technology & Management Program at University of Illinois Urbana-Champaign. The program is a joint university minor between The Grainger College of Engineering & Gies College of Business - University of Illinois Urbana-Champaign
with the goal to "prepare you to function effectively in a technical, interdisciplinary, team-based industry environment and it will distinguish you as a promising problem solver and future business leader." The program creates a tight network of very talented, driven,
outgoing & fun people. Certainly a high EQ & IQ crowd.

It is also the successful merger of skills & ideas that can be found on a college campus.

We may see something similar happening in The Merge. This week (estimated to be finished early morning on Sept 15), the Ethereum Network is launching the 2.0 version after a few years of thinking & testing ways to improve the speed of transactions & reduce the carbon
footprint of doing so. The network is home to about 71 million crypto wallets & uses about 112 terrawatts of energy per year. For this, about 15 transactions per second are done. There are several proof of work ways to create a new block to verify these transactions. After the
ideas "merge" there will be a new way called proof of stake, which will increase the potential number of transactions per second to as many as 100,000, faster than Visa & Mastercard. It is also estimated to reduce the carbon footprint of the network by 99.9%.

Instead of needing to have powerful servers solving an algorithm, holders of ETH will be able to put up their tokens or 'stake' their ETH which then allows for presumably secure & eco-friendly transactions. It also allows holders to earn a yield on this activity, which turns the crypto into a positive cash flow asset. This is seen to be a potentially very positive catalyst.

Right now, the markets overall are very bearishly positioned & for good reason. The news has been & is expected to continue to be poor. We need a catalyst, good or bad, to get a change in direction. For the last 2 years, ETH & all of crypto have mimicked the investor sentiment seen in all risky assets. You can see that ETH and NDX Index have moved hand in hand. Could The Merge be a catalyst in a very bearish mkt? Could the catalyst come from Ukraine?
China? Corporate earnings? We don't need much good news to get a change in positioning akin to what we saw in July/August.

When you bring together talented people with different backgrounds & perspectives who are willing to work together you can get promising solutions to our problems. I saw it this weekend with my daughter & her friends. We may be seeing this with The Merge. Where else could we
use this now?

Stay Vigilant
post media
www.linkedin.com
Gies College of Business - University of Illinois Urbana-Champaign | LinkedIn
Gies College of Business - University of Illinois Urbana-Champaign | 77,947 followers on LinkedIn. Gies College of Business at the University of Illinois at Urbana-Champaign is home to approximately 3,000 undergraduate and 1,000 graduate students in MBA, master’s and doctoral programs. Internationally recognized as a leading business school, Gies Business has outstanding programs in accountancy, business administration, and finance. Consistently ranked as one of the top public universities in the nation by US News & World Report, Forbes, and Bloomberg BusinessWeek, the University of Illinois is also a leader in business education and research.

I’m a holder of $ETH.X and believe in them more than any other crypto. But their team claiming they’re going to be faster than Visa & Mastercard (15 to 100,000 tps is a massive leap), and drop emissions by 99.9% sounds a little crazy to me. That’s one hell of an improvement in one step/upgrade. We’ll see. I sure hope so. Right now they want ~$200 worth of $ETH.X to stake $20 worth of $CRV.X most of the time🤦‍♂️the price has ranged from $180-$240, depending on how busy the network is, which is absolutely absurd.
Add a comment…
Stay Vigilant blog
The latest Stay Vigilant post is out. A big part of it is covered in my discussions on The Yield podcast.

If you enjoy, like and subscribe. If not, dm me to tell me why.

Either way ...

Stay Vigilant
#markets #investing #stocks #bonds #optionstrading

stayvigilant.substack.com
Where are we going now?
Yieldstreet had me on to talk about the markets right before Jackson Hole. Two weeks later, we are still facing the same sort of market

Watchlist
Something went wrong while loading your statistics.
Please try again later.
Already have an account?