'Twas the night before Christmas, when all thru the ranks
Not a trader was stirring, not even their dranks;
Their PNLs were hung in the Box folders with care,
In hopes that a big bonus soon would be there;
The PMs were nestled all snug in their beds;
While visions of fast cars danced in their heads;
And the COO in her 'kerchief, and CIO in their cap,
Had just settled their bonus pool for a long winter's nap,
When alerts on Bloombergs began to ring with a noise
They ran to their desks expecting profits and joys
Away to my terminal I flew like a birdie,
To write a LinkedIn that is always too wordie.
The data that showed all across my computer screen,
Gave soft-landing vibes & markets were green,
When what to my curious mind did get stronger,
But a feeling that rates were to be higher for longer
With a little old Chairman so stubborn & slow,
I knew in a moment he must be JayPo.
Still fearing the mem'ry of one Arthur Burns,
He called out his colleague giving each one their turn:
"Now, Goolsbee! now, Harker! now Bostic and Cook!
Hey, Schmid! Hey, Barr! Hey Kugler you look!
We've seen this story play out many years in the past!
We don't want inflation to reignite much too fast"
While traders heard the rumblings they turned a blind eye,
Because every market was heading straight to the sky;
So on to the Substack this writer then flew
With a blog full of charts and commentary too—
I wanted to remind all the readers of risks
That were in the news but where none thought exists
As I wrote in my head, and was turning around,
Straight my inbox scary stories abound.
Drones were shot down and geopolitics seemed scary,
But shipping & transports had me feeling quite weary;
A bundle of problems I seemed to pick up like sticks,
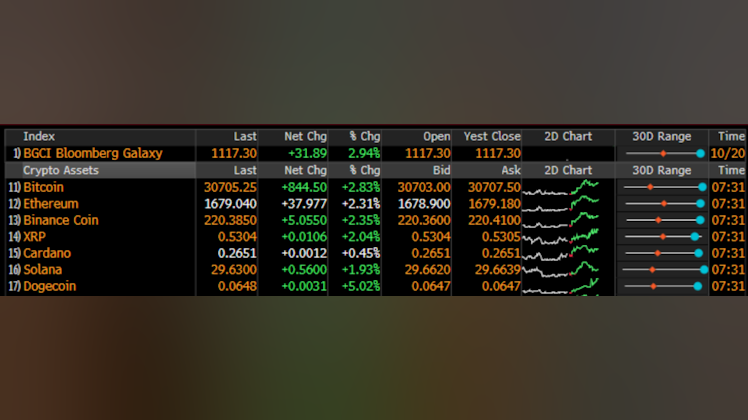
And was shocked to dig in to find a very low VIX.
My eyes—how they twinkled! Option ideas could be fun!
But also did worry that the theta would cost tons!
(Theta is the amount that the option premium decays,
when the markets are quiet like during slow holidays);
So I took a deep breath and said time to go slow,
Let's look for spreads in March when stocks may go low;
But for now I understand that it is Santa rally season
Traders are riding longs and need not give a reason
Many people choose to fight it with much sturm und drang
But for me I just chill out knowing markets yin and yang
So keep your positions tight and enjoy the year end rally
But don't get too complacent when you are checking your tally
There is an old saying that market vets say 'bout these gains
Don't confuse a bull market with someone with brains
I will be done writing these missives each day for this year
But for the readers I'll be back soon as 2024 is near
As for now I want to enjoy my family and friends,
And not give a darn how much anyone spends.
So I want to exclaim, as I go out of sight—
“Happy Christmas to all, and to all a good night!”