Trending Assets
Top investors this month
Trending Assets
Top investors this month
$ROKU Chart Bonanza
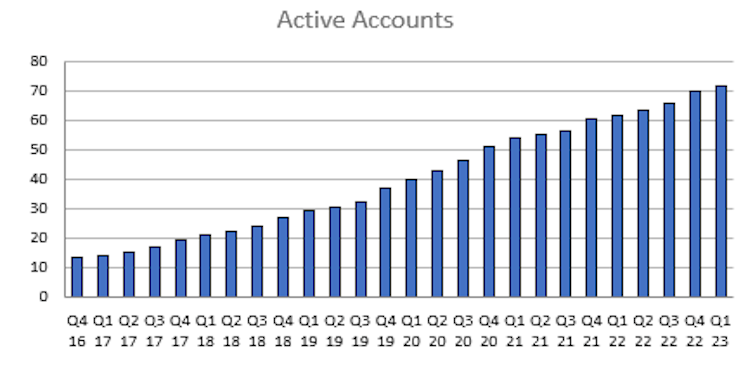
$ROKU encouragingly continues to grow active accounts:
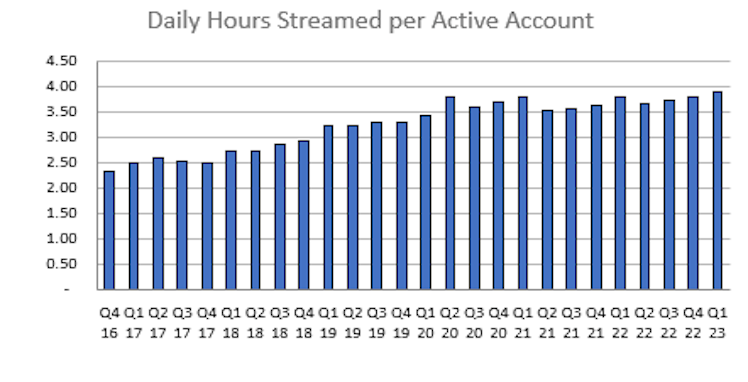
And engagement:
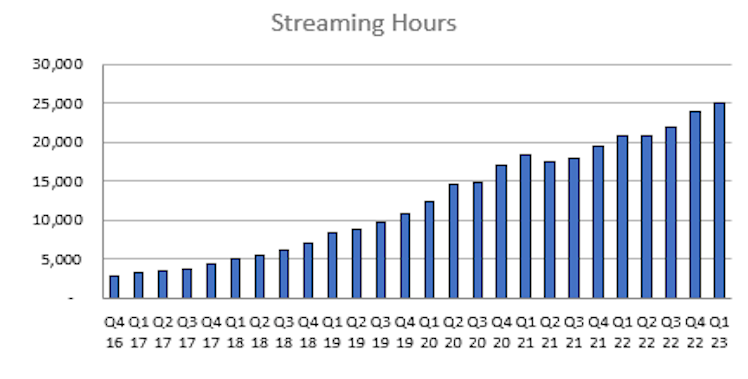
Leading to growth in total platform streaming hours:
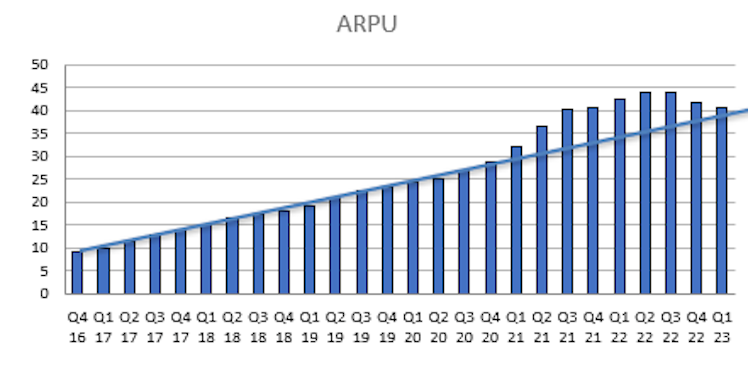
ARPU is back to pre-covid trend after 3 straight quarters of sequential decline. It will be key to see ARPU re-accelerate back to trend from here.
Platform revenue down YoY for first time in Q123:
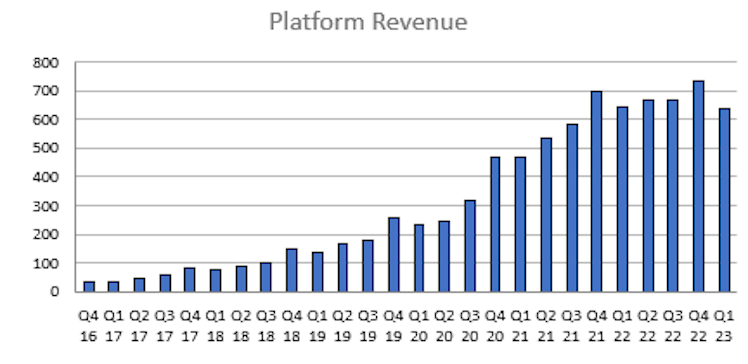
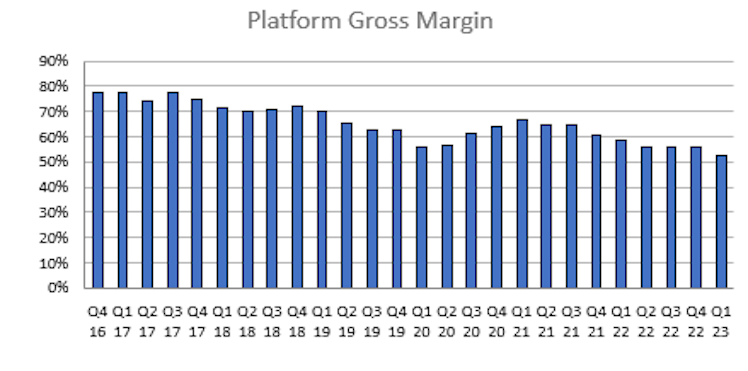
And platform gross margins have been declining (more on this below).
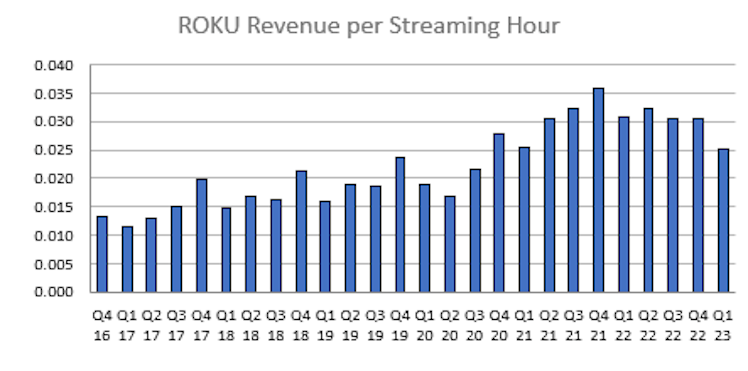
Roku is monetizing time spent on their platform at $0.025/hour. Linear TV was at $0.25 in 2017.
Nice to see they were able to achieve a significant decrease in opex sequentially for the first time:
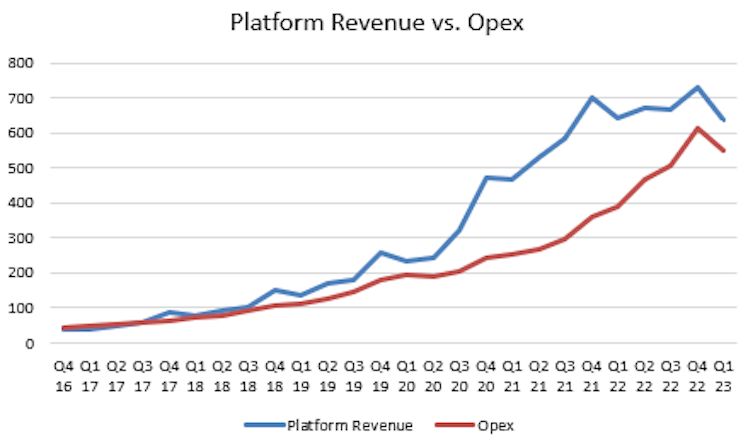
But YoY opex growth is still far outpacing platform revenue growth:
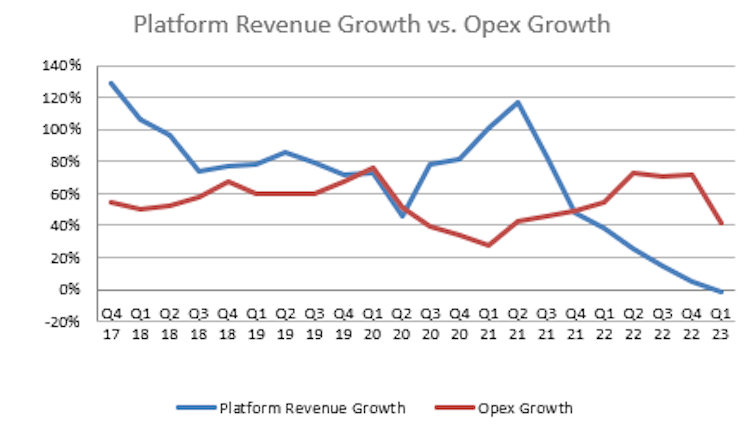
The business showed it had inherent operating leverage when they reduced costs due to covid uncertainty during 2020-21. I believe they will be able to get opex under control.
So, I think the business levers on which investors must form a view on are:
-Active accounts (largely a function of growth internationally)
-Engagement (specifically: streaming hours per account)
-Platform monetization rate (specifically: revenue per streaming hour)
-Platform gross margin
Active accounts and engagement have been growing steadily, and I see no reason to believe they won't continue to until it starts to show up in the numbers.
Platform gross margins remain the most perplexing to me. To my knowledge, mangement has given no formal guide as to what investors should expect gross margin to be at maturity (please let me know if they have!). Management attributes Q123 decline to "weakness in the ad scatter market, along with a greater mix away from M&E in Q1 2023 compared to a year ago period." This trend has been going on since 2016 IPO with a brief interruption during covid. M&E stands for Media & Entertainment and consists primarily of content publishers' promotional spending on the Roku platform, such as buying branded buttons on the remote or real estate on the home screen, which comes with ~100% gross margin. My view is that "greater mix away from M&E" explains the ongoing decrease of platform gross margin over time, as more and more of Roku's platform revenue comes from digital ads and less from content distribution services, which inclues M&E revenue as well as revenue shares on on-platform new subscription sign-ups and transactions.
Right now, the (maybe variant?) take I'm MOST comfortable with is that monetization should close the gap over time from today's $0.025/hour to linear cable's $0.25/hour. That's a 10x increase just to match linear, and Roku should have much better viewer data and ad targeting, and thus higher CPMs. On the other hand, ad inventory shares with content publishers are negotiated on a case by case basis, and Roku may be sharing 70%+ of ad inventory with certain publishers. This data is not disclosed. So, today's $0.025/hour might not be an apples to apples comp to cable's $0.25/hour. In a bear case, assume 30% * $0.25 = $0.075 is the actual monetization gap to be closed. That's still a decade of double digit growth in monetization rate ahead for the business.
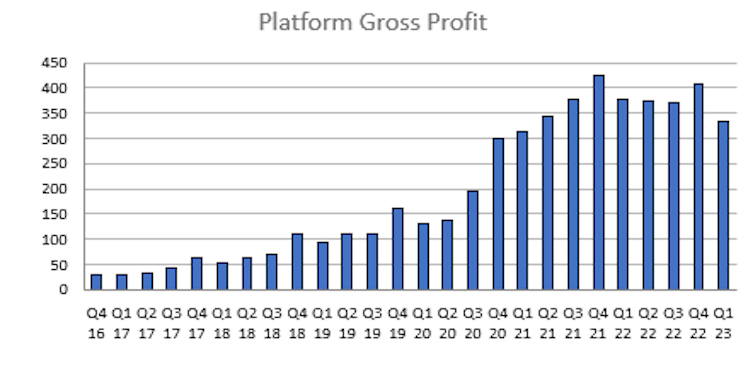
Since both monetization rate and platform gross margin would seem to be largely driven by the terms of Roku's ad inventory/revenue share agreements with content publishers, there is probably an inherent trade-off between the two, i.e. a lower monetization rate will feed through into higher gross margins and vice-versa. As such, growth in platform gross profit dollars is probably the key metric to hone in on, and that has been deteriorating since Q2 22 and declining YoY since Q3 22:
Curious to get your thoughts @tsoh_investing @ccm_brett as well as others!
Already have an account?