Trending Assets
Top investors this month
Trending Assets
Top investors this month
Dividend Preview
I typically do a weekly dividend forecast on Monday mornings. This week is the second in my dividend dry season - no dividends this week 😭. We will be back at it with dividend income in May!
Last week I covered my Dividend History. This week I will be covering my Dividend Preview using the helpful tools at Track Your Dividends to show my future dividends and growth!
Track Your Dividends (TYD) offers the ability to track multiple accounts, as well as a summary of all accounts. Below are all Summary data:
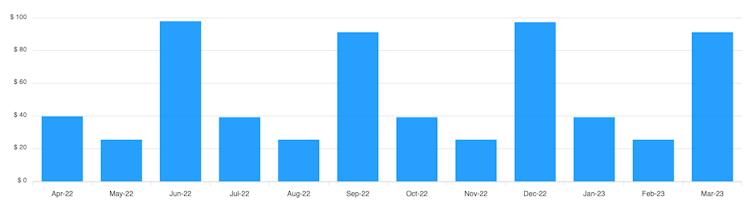
We'll start with my Next 12 Months (NTM) dividend forecast. It is nice how TYD shows each month as a bar graph, including min, max and % variance month to month. This is a very helpful tool for those looking to develop a steady month-to-month dividend income.
NTM Min: $26 (May, August, November, February)
NTM Max:$98 (June)
NTM Variance: 73.9%
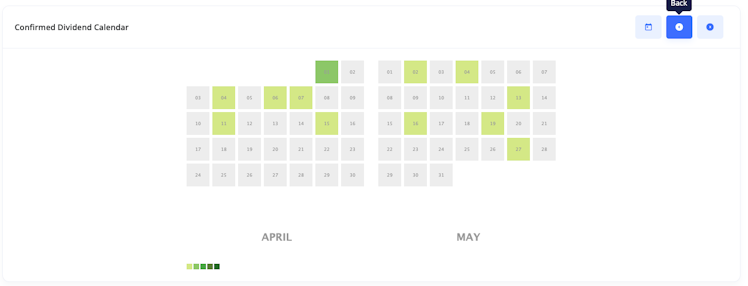
There is also a Confirmed Dividend calendar that is formatted with the greenest days being the highest dividend payment days. Below is my confirmed dividend calendar from April and for May. January, April, July and October 1 are my biggest dividend days with my largest dividend income, $CMA, paying out on that day.
Finally, we will visit the Future Value Tool. This tool calculates the future value of your portfolio and dividend income using historic growth rates to calculate future value. There is a table below that can be customized for expected Dividend Growth Rate, Annual Contributions, Price Appreciation and Maximum Dividend Yield. The below chart was calculated using the default values:
5 Year DGR: 6.51%
Annual Contributions: $0
Price Appreciation: 3%
Maximum Dividend Yield: 10%
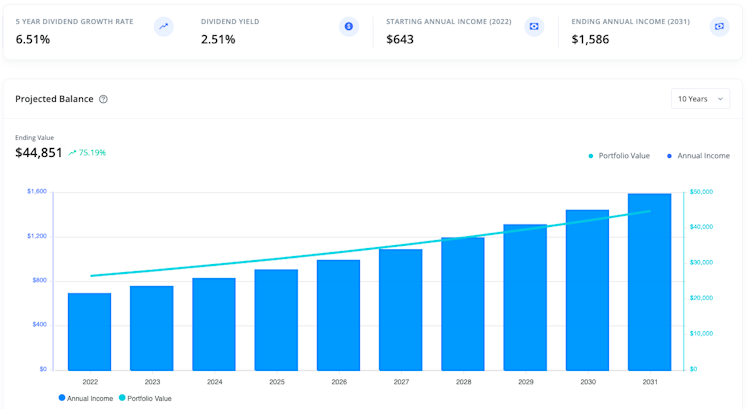
Pretty neat to see how the dividend snowball will continue to grow!
Have you ever used Track Your Dividends? What tools do you use to track dividends and project growth?
Already have an account?