Trending Assets
Top investors this month
Trending Assets
Top investors this month
$13.1MFollowers
$SU - Episode 1: Why 'cup and handle' formations happen
Get yourself a coffee and make yourself comfortable before settling down for this one. I got very emotional and things got way out of hand.
-----------------------------------------------------------
Suncor Energy posted killer earnings yesterday and doubled their quarterly dividend, closing 13.19% up today as a result. Even without these two pieces of fundamental information, $SU has a number of bullish chart patterns that I annoyingly missed because I'd never even heard of Suncor; rest assured they are now on my Energy watchlist.
But the silver lining here is that the density and nature of the signals will fuel my memo writing for a couple of days :) And before I get into the meat of the subject, it wouldn't be a 'Michael Memo' if I didn't waffle first.
Waffle
Technical Analysis is often perceived to be the mind-numbing memorisation of seemingly arbitrary price patterns. And, to be fair, that's exactly how I started to learn it and how I imagine most others have. But staying at this surface level of knowledge has HUGE pitfalls and puts traders that do so at a great disadvantage. The concepts and practice of technical analysis were there before the patterns had names, and so it stands to reason that if you understand how the patterns form then ultimately you won't need them any more (I'm nowhere near that level btw). You'll also begin to realise that many of the patterns are exactly the same phenomena but with a different name (most likely so somebody could sell a book on the matter).
The Meat
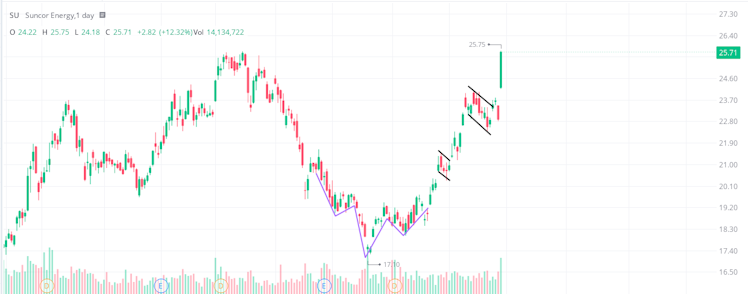
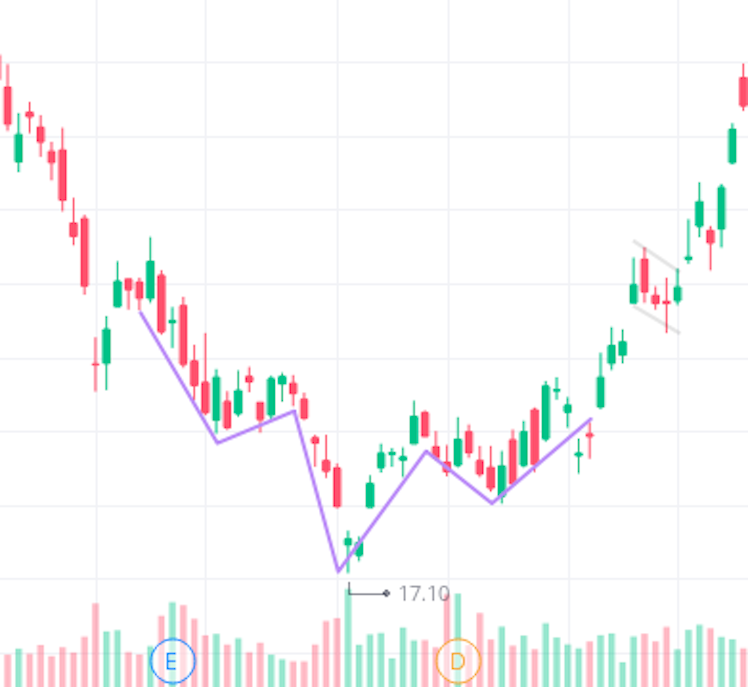
In the image above we can see an 'Inverted Head and Shoulders' pattern (purple) and two 'Flags' (black), and I'll cover those in Episodes 2 and 3. Interestingly, in this instance, they are also part of a larger 'Cup and Handle' (CAH) pattern.
The CAH is a bullish continuation pattern - you would expect to see it during a pause of an extended rally and for the price to continue up afterward.
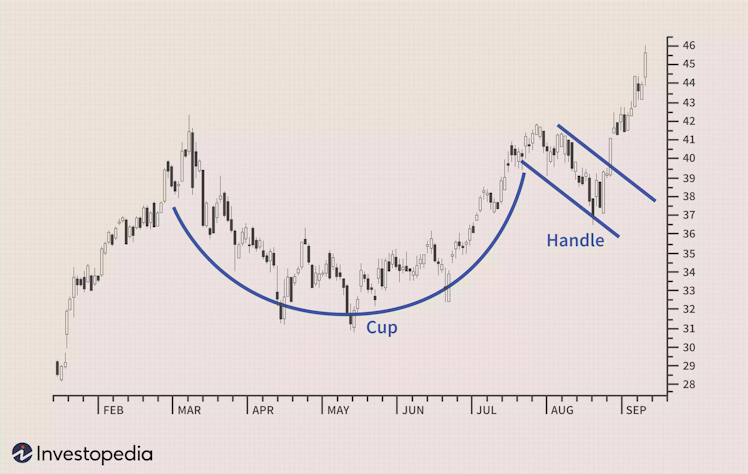
In textbook examples like the one above, the price reaches a 'relative high' before curving down and back up to a resistance point which, in this case, is the previous high - here is our cup.
The price then abruptly drops down, though no lower than the bottom of the cup, before continuing the original uptrend - here is our handle.
Looking again at $SU, we can see how the chart looks to have to completed its CAH and is on its way back up.
Some of you might have already noticed how the handle is, quite simply, a Flag. That isn't a happy coincidence that just so happened on $SU but that is exactly what the handle is (remember earlier when I said TA is all the same stuff with different names?).
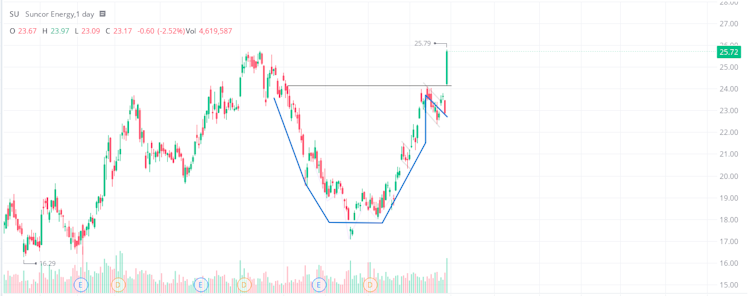
Now that we've established the handle is just another name for a Flag, what is the cup if not a 'curved bottom'?
Jesus Christ, if you google 'curved bottom chart pattern' this is the first image you get and it's a fucking Cup and Handle!!! Look at the flag on the right-hand side of the cup!!! IT'S ALL THE SAME STUFF!
Now, this may seem as though I'm over-simplifying things but I'm really not - what is a 'curved bottom' if not just a smoothed triangle?
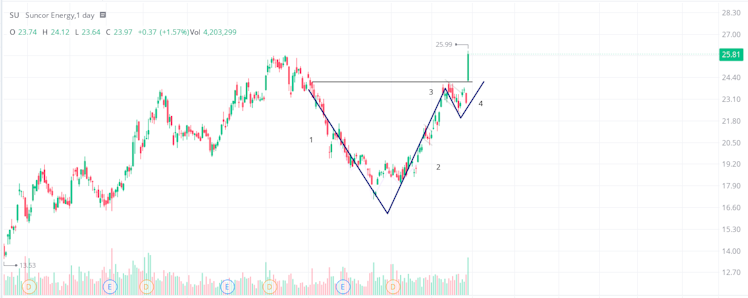
It's now much easier to interpret a CAH as its constituent parts. Part 1 shows a simple retracement from a new high in an up move. Part 2 shows that the bears have lost interest and the price is low enough again for the bulls to resume buying. Parts 3 and 4 are just a smaller version of 1 and 2; a retracement from a high before returning back up the resistance (and hopefully breaking it).
Examples
I've managed to find some good examples to illustrate my point.
Below is $ASML's daily chart. We've got CAH on the brain so you can probably make out the pattern below quite easily, but still try to consider it as separate parts.
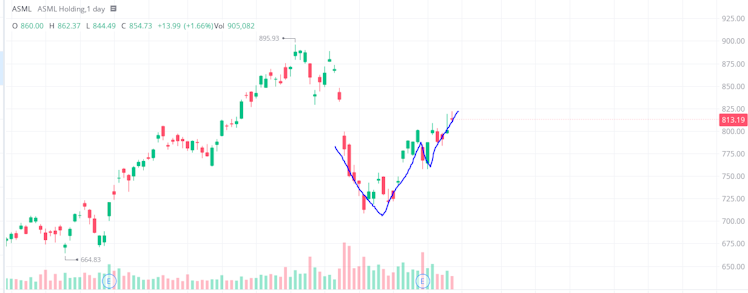
- We reach a high in a rally
- There's a retracement
- The price goes back to a resistance (in this case it was a large downward gap)
- Falls a second time, but smaller than the first.
- Rallies again and passes the resistance
$COIN did the same thing from the start of September to mid-October
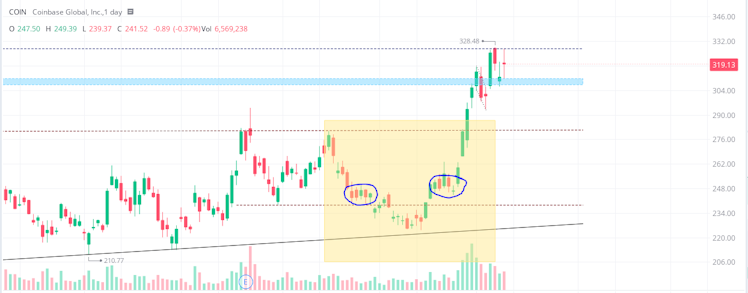
- We reach a high in a rally
- There's a retracement
- The price goes back up to a resistance (in this case the resistance turned out to be the brief sideways movement before continuing the retracement)
- Falls a second time, but smaller than the first
- Rallies again and passes the resistance
$ALLK is a bit more of a complex example but it follows the exact same principles. It's very 'not textbook' though I bet we can do it even without any crayons.
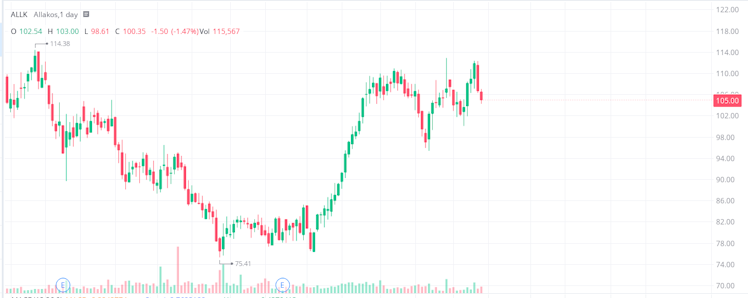
- We reach a high in a rally
- There's a retracement
- The price goes back up to a resistance (in this case, the previous high)
- Falls a second time, but smaller than the first
- Rallies again and passes the resistance BUT
- Falls a third time, but smaller than the second
- TBD
$BOX is even more abstract but you will still see the exact same thing.
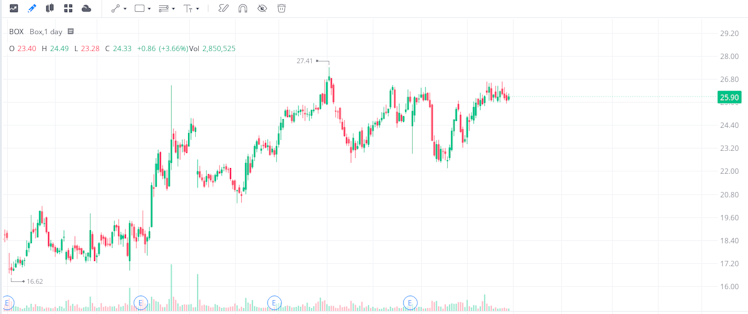
In fact, you might see two CAH patterns side-by-side, the first being a 'failed signal'.
However, I still haven't explained the underlying reason why this happens. It's a combination of order absorption and...things I don't know yet (such as Elliot Wave Theory) though I will make sure to waffle when I do. But what I do know is that once you start scratching the surface you can see the 'patterns' in a lot more places.
Join me next time for "**$SU - Episode 2: The Head and Shoulders is just a Cup with Two Handles"** (yes, it really is that simple)
Already have an account?