Trending Assets
Top investors this month
Trending Assets
Top investors this month
Turtle Trading - The Trend Following Way
You’ll have seen in a few of my portfolio moves that I have restructured a bit to allow room for multiple strategies. One of which is using Richard Dennis’ trend-following technique. In this article I will explain who Richard Dennis was, why he is awesome, what his strategy was, and how I am implementing it into my dividend portfolio.
All of the information I’ve come to know about Richard, his story, and his strategy has come from a book by Michael W Covel called “The Complete TurtleTrader: How 23 Novice Investors Became Overnight Millionaires” and a bit of extra online research. Covel has been the leading expert on all things Turtle traders for some time and has the first ever “on-record” interviews with actual Turtle traders. It is a great read, not only to learn about the strategy, but also for the riveting story.
Who Was Richard Dennis
======================
Richard J. Dennis, the legendary trader with an uncanny knack for spotting trends, has left an indelible mark on the world of finance. Born and bred in the Windy City, Chicago, Dennis was a natural-born market aficionado from an early age. At 17 he became an order runner at the CME trading floor in the 60’s. He worked his way up to trading his own account and ran his own orders with his dad’s help.
Richard borrowed $1,600 from his family to invest, $1,200 went to buying a seat at the MidAmerica Commodity Exchange where he traded. That left him with only $400 in trading capital. By 1973 he grew that $400 to over $100,000. In 1974 he made over half a million in profit trading soybeans and became a millionaire at 26. He quickly earned the nickname “Prince of the Pit”.
Dennis’s illustrious career can be traced through different phases of amazing achievements. He established himself as a commodities trading legend, riding the waves of market trends with surprising ease. He had an unbelievable ability to spot profitable opportunities in the chaos of the markets including the era of commodity volatility in the 70s. Sugar, coffee, soybeans, and wheat all experienced crazy surges in prices due to Soviet Union demand and hoarding shifting the market.
It was in the 80’s that Dennis really made a name for himself with his “Turtle Traders” experiment. Dennis believed that anybody could be taught to trade, while his partner and friend, William Eckhardt, believed success in markets was a product of talent and skill.
In order to settle their debate, they created the Turtle Traders, a hand-picked group of 23 aspiring traders, fondly known as the “Turtles,” and trained them in his proprietary trend-following strategy. The Turtles were trained for only two weeks, taught the simple rules of Richard’s trend-following strategy, and then set loose with Dennis’s own capital to trade. These Turtles went on to make serious dough, earning millions and hogging the limelight in the trading community and the media.

Dennis’s legacy is the stuff of trading legends, challenging the notion that trading success is all about gut instincts. His trend-following strategy and risk management principles have inspired traders worldwide and ushered in the era of systematic trading. Dennis’s work continues to be a beacon of wisdom in the ever-changing landscape of finance, and his legendary status as a trading maverick remains unshakable.
So, here’s to you, Richard Dennis, the trend-whisperer, the Turtle maestro, and the guru of systematic trading. His contributions to the trading world have left an indelible mark and has planted in me the confidence to make the trend my friend! But how exactly do you do that?
The Strategy
============
Instead of quickly scalping commodity contracts on the CME floor like most other traders did, Richard developed his own strategy that allowed him to scale into strong trends like the sugar spike of the 70’s and earn greater returns over time.
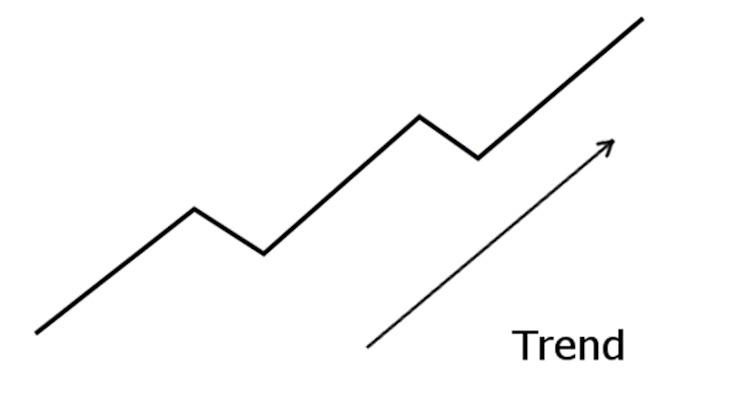
Richard and his Turtles used two trading systems for trend following. I’m only going to follow the first strategy, so if you’re interested in the second, go read the book. The first system used a 20-day price breakout as a signal for an entry and a ten-day breakout in the opposite direction for an exit. Notice that I don’t point out which direction, this is because the strategy can be used both long and short. I will only be using it long for positions and inverse positions.
While this rule is straightforward, there are some more caveats to it. First, is the filter rule. The Turtles used a filter that was designed to increase the odds of finding a trend. They would ignore an entry alert if the last twenty-day breakout indication was a winner. Even if they did not take that trade, if it was a theoretically winning trade, they would not take the current breakout.
Once a breakout is found, you must measure the volatility of the investment. The Turtles used the Average True Range (ATR) as their measurement and nicknamed it “N”. ATR is the absolute distance the equity moved in a 24 hour period, they would use the 20-day moving average of this value as it gave the sample volatility for the last few weeks. The Turtles used a hard 2N stop, which is known as their contract risk. They used the term “contract” within their own terminology frequently, this is because they traded in futures contracts. For me, however, I am following this strategy with shares, so we will keep our examples in that context. For an example of a stop, if $AAPL had an ATR of 10, your hard stop would be $20.
Once N was understood, the Turtles had to determine how much to invest. They would bet a fixed 2% of their capital on each trade, each 2% bet was called a unit. They had unit limits on any market sector and unit limits on individual positions. Then they would determine their contract risk. The number of contracts to buy is determined by taking the 2% account risk and dividing it by contract risk. Again, if we are using $AAPL as an example, on a $10,000 account, the most the system will let you lose is 2% or $200 on a trade. If $200 is my account risk and the contract risk is 2N (2ATR) which is 20 in this example, then my position size would be 10. If your calculation gives you a decimal, always round down to the nearest whole number.
These rules made any futures contract for any commodity an equivalent figure. A unit of corn was equal to a unit of gold and was equal to a unit of $AAPL shares, essentially making Richard’s strategy a numbers game with no fundamental expertise in any individual market or industry.
In this strategy, N really has almost two meanings. One is a measurement of volatility and the other is a measurement of unit size. It takes a little bit to wrap your head around, but eventually the light bulb turns on and you get it. Once you understand volatility and position sizing, the next step is pile into your winning trades.
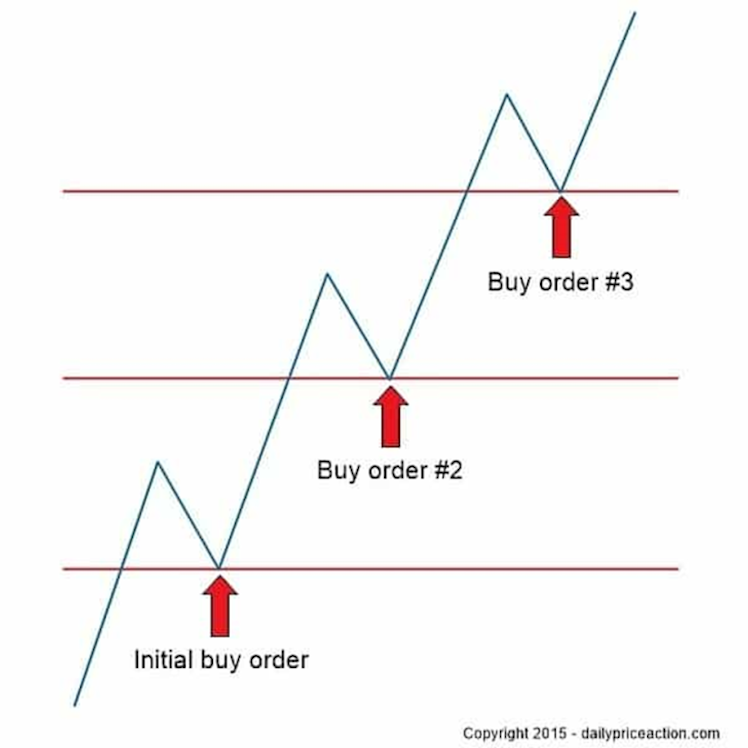
Richard’s partner, William Eckhardt, told the Turtles to add into their winning trades. This would maximize their winners and is what helped to create the strategy’s edge. Once a breakout was alerted, and a turtle entered a trade, their next step was to add to the trade at every N level. If a particular stock broke out at $50 and had an N value (ATR) of 5, a new unit would be added at every N level of $55, $60, $65, $70, and so on. They were allowed to pyramid into a trade for a maximum of 5 units. On the first day of an entered trade, stops were 1/2N, then after that the customary 2N was used. When N levels were hit and new units were added, all stops were brought up to the newest unit’s 2N stop.
This strategy protected profits, but not to the point that it would prevent the Turtle from missing out on the larger trend. This idea also guaranteed that profits would be piled into those big unpredictable trends that the Turtles were able to catch.
There is a catch here though, aggressive pyramiding had a downside when false breakouts occurred, and no big trend materialized. Those little losses would eat away at capital. When dry streaks happened, the Turtles cut back on the unit sizes. The rule was that for every 10% drawdown in their account, the Turtles would reduce the size of their units by 20%. Once their capital started going back up, they would revert back to normal unit sizes. If they were going to ruin their accounts, they would ruin them effectively, however this wasn’t the case as most Turtles did tremendously well under this strategy.
Under these rules, Richard Dennis and his Turtles made millions. Several of the Turtles had gone on to pursue their own professional trading careers. Their continued performance is proof that sticking to a system over the long haul can bring great success. The most notable of the Turtle traders had amazing years, with returns as great as 188% and losses controlled to -32% at the most in a single year. Most of the Turtles were able to grow their accounts from Richard manyfold in a few years before the end of the experiment, only to continue trading for themselves afterwards.
Their story is motivational in that it shows that it is possible to learn the steps that top traders follow and replicate the process. However, the story also shows that mental toughness and drive is needed, as not every Turtle found vast success. Regardless, the overall win rate and performance of the Turtles was proof enough for me, so I decided to give it a shot as part of my portfolio.
Dividend Dollars’ Implementation
================================
As is evident in the new restructuring of my portfolio (read the latest portfolio update here), I have allocated 15% of my account to following the Turtle’s strategy. I have been playing with the strategy a little bit in my trading accounts on the side and am excited to deploy it into my main account. If this strategy works, any gains on those funds over and above the 15% allocated amount will be used to grow my long term positions. Investing long term is boring and slow, but it is the best and safest way to build wealth, so I am sticking too it! However, if I can deploy this strategy properly and grow my funds a bit faster with a portion of my funds, we may be able to reach the end goal of financial independence sooner compared to without! So that’s the goal, lets dive into the implementation.
I will only be trading ETFs under this strategy, not futures contracts like what the Turtle’s traded. This has caused me to need to tweak the strategy a little bit, as contracts are much more volatile than stocks, therefore, when using the 2% profile risk and 2N (ATR) contract risk to calculate position size, the resulting positions sizes were much larger than I would have liked. Therefore, I have shifted the risk per trade down from 2% to 1%.
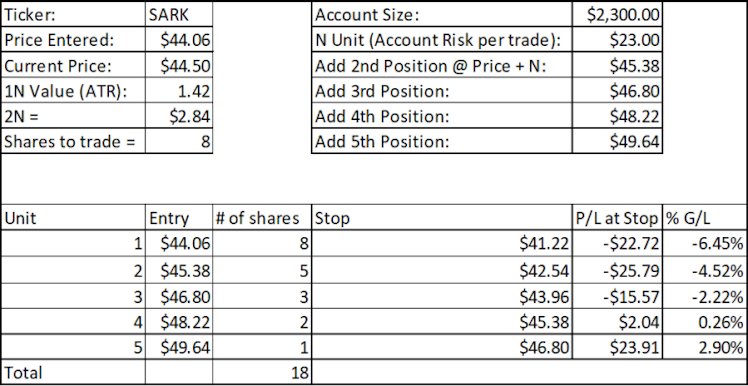
Through my experimentation, I also found that it was rare for a large enough trend to form and take my position through a full 5 units before breaking. Because of this, losses were way more common than winners. I decided I needed to find a way to ensure that the breakeven point, and therefore profits, would come in sooner unit adds rather than all the way through the fifth unit. Therefore, instead of adding the same unit size at every add level, I have scaled down the consecutive units by 40% with each add. So If my first unit is 10 shares, the next would be 6 shares, then 4 shares, 2 shares, and finally 1 share. This way, as the trend grows, my average cost of shares doesn’t grow in step and my breakeven point would occur somewhere between third and fourth unit, allowing me to make minor gains rather than a loss of the trend breaks earlier than desired.
This also means I have less total capital deployed in each trade with each added unit compared to the standard strategy, this frees up capital for me to put to other trends if I can find them. Below is a screenshot of a table I have created to track my trend trades, the ATR, the add and stop levels for each unit, and the projected profit/loss at each 2N stop level.
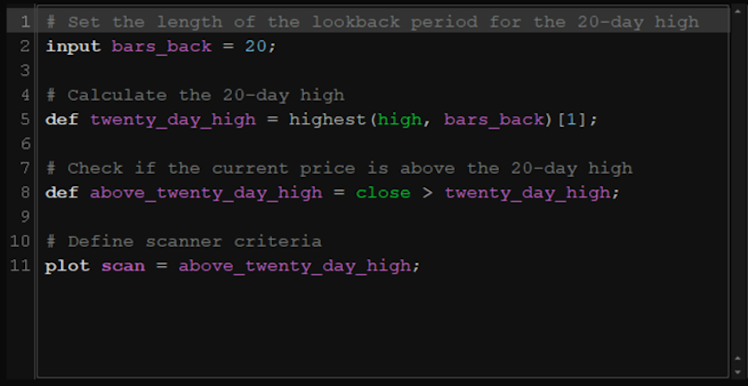
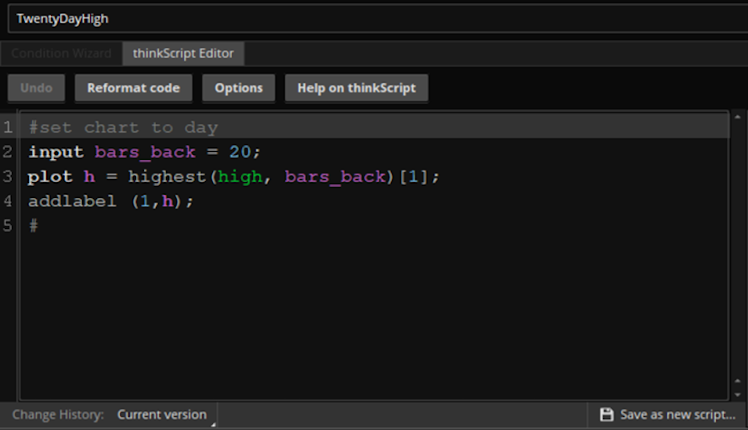
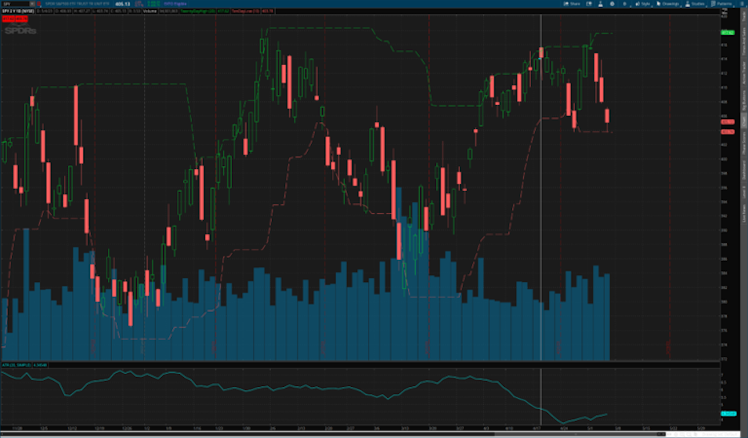
How do I go about finding the ETFs that are hitting 20 day highs? Using ThinkOrSwim, I have stock scanner set up with some ThinkScript that finds stock prices that are pushing above their historical 20 day highs. I also used the same code to create a chart indicator that shows the 20 day highs and 10 day lows so that I can visually track the entries and exits of these plays. Below is a screenshot of the code for the scanner and for the chart indicator. Use the same logic for a 10 day low. Also below is a screenshot of $SPY using the indicators that show the 20 day high and 10 day low.
With all of this set up, ThinkOrSwim alerts me to when a new ETF fits the criteria of my scanner. This triggers an entry assuming the filter rule is not broken. At that point, I use my spreadsheet to calculate my risk, I get my ATR, I calculate my entry size, figure out my add level, calculate my stop level, and follow the systems rules.
So how well does this work? Currently, I have no actually rode a trend all the way to 5 units yet. But when that happens, anything above and beyond 5 units is a stellar gain. We are in such a choppy market right now that I have been achieving small losses. But that’s okay. That is how the system operates. It’s like throwing spaghetti at a wall and seeing what sticks. Most times the trend breaks within a few days, but that one or two strong trends that you may catch could make your whole year.
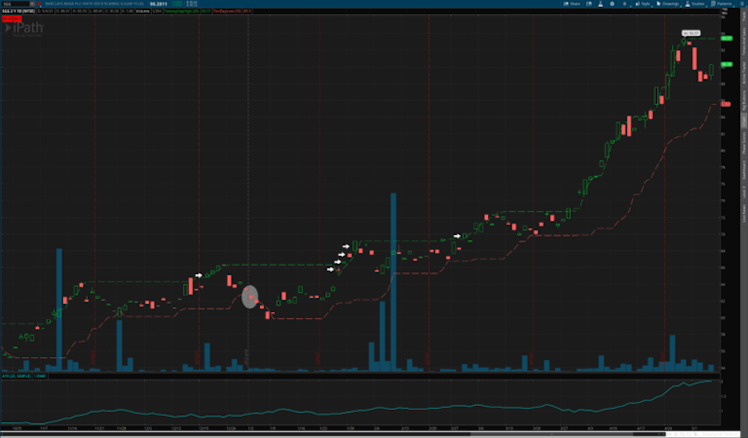
For example, lets look at $SGG, this is Barclay’s sugar futures ETF tracker which has had an absolutely wild 2023. On January 6th, the ETF went above its 20 day high, triggering an entry (it also cleared the filter check as you can see by the first arrow and the break of 10 day lows). At entry on January 6th, the ETF cost $65.73 and had an ATR of .91. Using a $10,000 portfolio risking 1% per trade as an example, our entry size would be 54 shares with a stop of $63.91 and an add level of $66.64. Below is a screenshot of the table I use to track entries, stops, and unit sizing for this example also refer to the chart below the next paragraph.
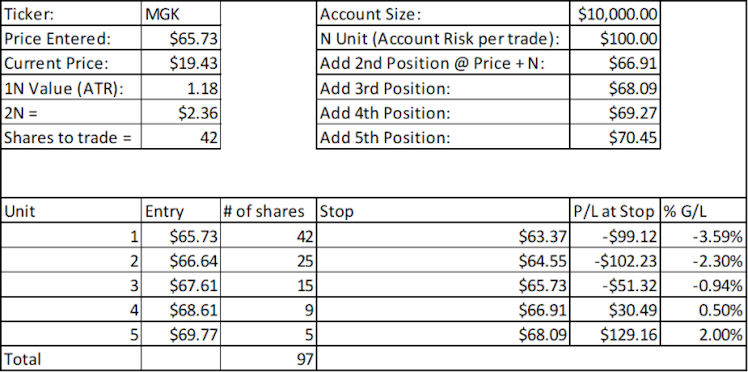
The add level was actually hit the next day, at which point we reevaluate our N stop and add levels and add our next unit size of 32 shares at $66.64. Next add is $67.61 and the stop is moved up to $64.79. Again, this add level was hit the next day, even though it ended up being a red day for the ETF. We go through the same exercise of adding now 19 shares, recalculating ATR, and moving adds and stops to $68.61 and $65.73. Again, the add was hit the next day and this time we added 11 shares and moved levels once more. The next and final add would be at $69.77 and stop is $66.74. Now here is where it gets interesting, the next add is never hit till March 1st, however the stop of $66.74 is never hit, neither is the 10 day low. So we would have held onto the position the entire time. On March 1st, we would add out final unit of 5 shares at $69.77 and move our stop to $68.09. From there, the 2N stop and the 10 day low stop has yet to be hit as of this writing. Your total position of 97 shares with a cost basis of $66.55 per share would be worth almost $8,800 and result in a trade gain of 35% or $2,300. That’s a 23% gain on the entire portfolio in one trade, and the best part is that the trend is not done yet. Who’s to say how far it will continue.
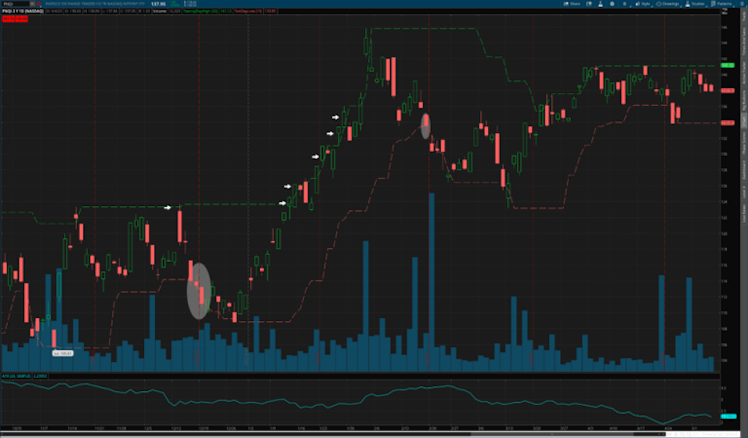
I won’t break down step by step other examples, but I will provide the screenshots! Take a look at $PNQI, $EWW, and $KOLD! Absolutely wild runs!

I’m hoping I begin to catch some wild runs myself by implementing this strategy. I haven’t caught a wild one yet, but it will come! Current positions I have under this strategy are $MEXX, $MGK, and $XLC. Stay tuned to the website and my portfolio updates to see what trends I try to find with the turtle strategy!
Thank you for reading this. If you found it helpful bookmark this post or the original article on my website. Also, please subscribe to the website on the homepage and follow my Twitter and CommonStock accounts.
Dividend Dollars
Trend Following Trading – I Am Now a Richard Dennis Turtle
Richard Dennis became a trading legend by teaching his "Turtle Traders" how to make millions in the 1980's. I am allocating a small portion of my capital to follow his strategy. Read on to see how it works!
Already have an account?