$2.9MFollowers
Playing w/ Numbers
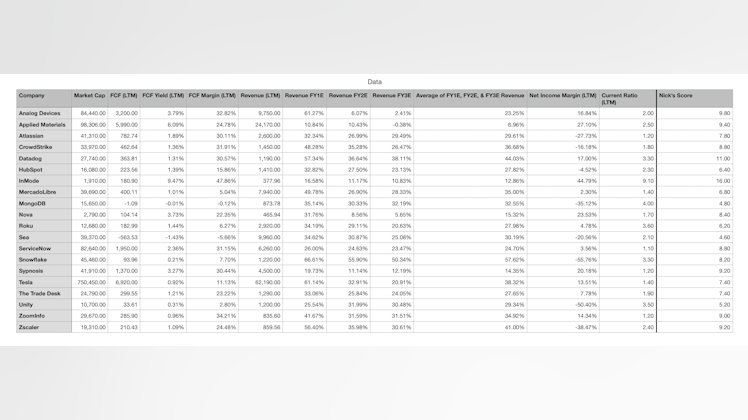
I apologize if the numbers are hard to see, but I built a spreadsheet to create my own way of determining a company’s financial health and growth prospects.
It scores based off the following financials/metrics:
1) average of next three year’s revenue estimates
2) fcf margin
3) fcf yield
4) net income margin
5) current ratio
The max points a company can receive in any single category is 10; the least is 0. Points are received incrementally based on that company’s metric. The final score, denoted “Nick’s Score” in the spreadsheet, uses the weighted average of their scores in each category.
Using the same order of the metrics listed above, we have the following weighting:
- each point for metric 1) is worth 5 points
- each point for metric 2) is worth 4 points
- each point for metric 3) is worth 3 points
- each point for metric 4) is worth 2 points
- each point for metric 5) is worth 1 point
Then you sum the points and divide by five (the number of scored categories) and voilà… you arrive at Nick’s Score.
I am aware that this algorithm isn’t inherently fair and equal as the companies above span multiple industries, are at different stages in the business cycle, and numbers don’t paint the full picture. I just thought it would be a fun exercise.
All questions, comments, concerns, and suggestions are welcome.
Is the superior Nick’s Score the higher number or the lower number? When I did this to create spreads for sports betting, it depended on how I set up the entire equation as to whether high or low number was best, always like more data regardless 🤣