Trending Assets
Top investors this month
Trending Assets
Top investors this month
@deerpointmacro
Deer Point Macro
$11.2M follower assets
Macro research and its impact on capital markets.
22 following337 followers
S&P 500 vs ERP
There isn't much predictive power in the equity risk premium.

The low and negative equity risk premiums in the early 90s were followed by decent S&P returns. Similarly, the high equity risk premiums in the mid-2000s were accompanied by periods of negative S&P forward returns.

Currently, with almost a negative equity risk premium, forward S&P returns have been elevated.
post media

Bonds and Currency
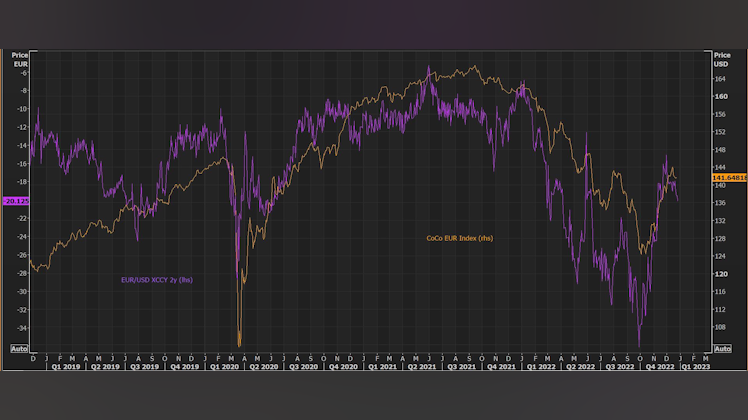
CoCo bond index vs XCCY, interesting how close these two follow each other, but it makes sense. As issues start to arise in banking system, funding markets start to demand higher premium for lending due to counterparty risk. This leads to drawdowns in fixed tenor CoCo as they tend to underperform during times of credit and solvency issues. When such issues happen many CD/CP volumes drop as money market funds become more defensive thus removing short-term credit for non-US banks who then have to turn to funding markets to try to ease stress.
post media

Deutsche Bank Bonds
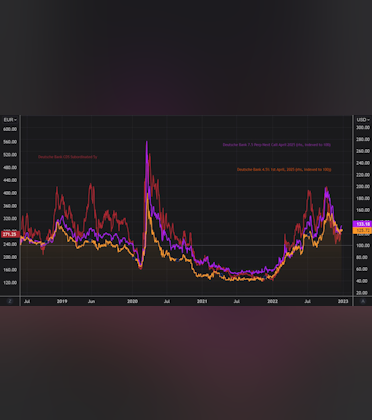
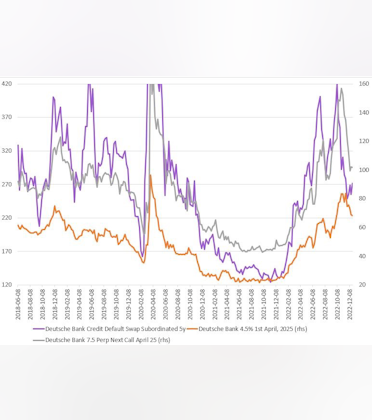
There has been a huge change in the bonds issued by Deutsche, and this comes in shifts in the perceived credit profile of Deutsche bank. As we can see the CDS to be used as a proxy for risk has seen a massive rise in the bid-yield of the perpetual, and a similar time not shown on this chart as perpetuals are more sensitive to default risk the perpetual CoCo did not outperform the fixed tenor CoCo. Now that default risk and worries about credit quality seem to be easing, we should continue to see perpetual CoCo take the lead in the outperformance. However, for those who think that the economy hasn't yet, seen a full economic downturn the fixed tenor, would still be the better place to be.
post mediapost media

Liquidity conditions
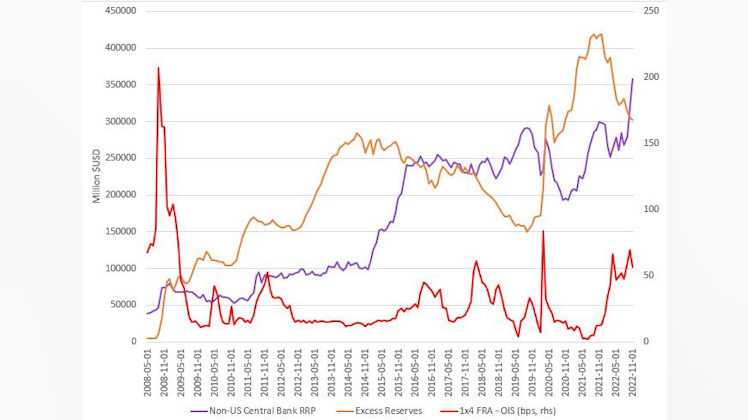
Higher FRA-OIS which is the forward rate agreement - overnight index swap (FRA rate banks demand) OIS (overnight risk free rate) is a proxy for borrowing costs. When risk premiums or the market demand for a higher risk premium rises the spread widens. The funds current path is creating conditions in which that premium is elevated, and this is ensuring a tighter stance then might be necessary. Reserves are draining fast, and at the same time foreign entities are still seeing the current repo rate 430bps as more attractive than many treasury yields. Now based on the chart below, what we could see is the Fed starting to create a issue for liquidity within the market, thus they would either need to cut or start QE to ease liquidity conditions. Happy holidays everyone.
post media

China Reopening is it a silver lining?
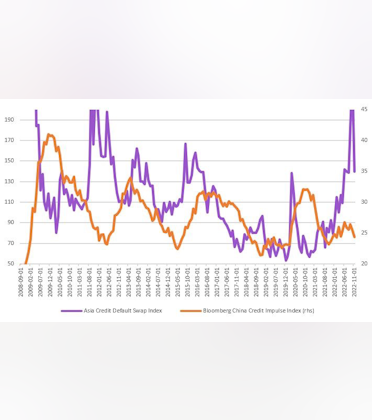
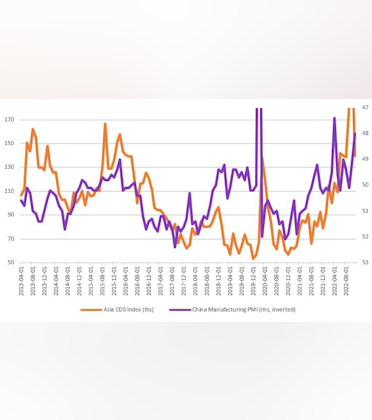
China plays a very important role in stabilizing Asia. With contraction within China in terms of PMI this usually leads to increased protection in Asia CDS, as investors demand protection against possibly defaults. This is to be expected, with China's dominance in the region, and the economic powerhouse that it is. If we continue to see slowing growth, as can also be seen and measured by the credit impulse out of China in the second picture. Chinese growth even with the reopening absent higher loan growth/GDP, growth might be stagnant. This should keep risk especially within the real estate and banking sectors within Asia at risk.
post mediapost media

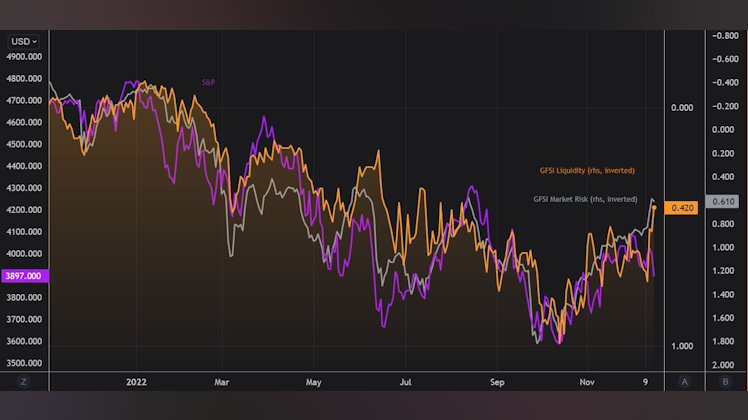
Equity aren’t flashing bearish signs
Liquidity and market conditions are easing, and this usually follows drawdowns in the S&P and or sell off in the market. Currently no bearish signs for equity markets.
post media

I agree S&P has been really resilient but "under the hood" some stocks have already been hit really hard and reflecting pretty negative scenarios.
Add a comment…
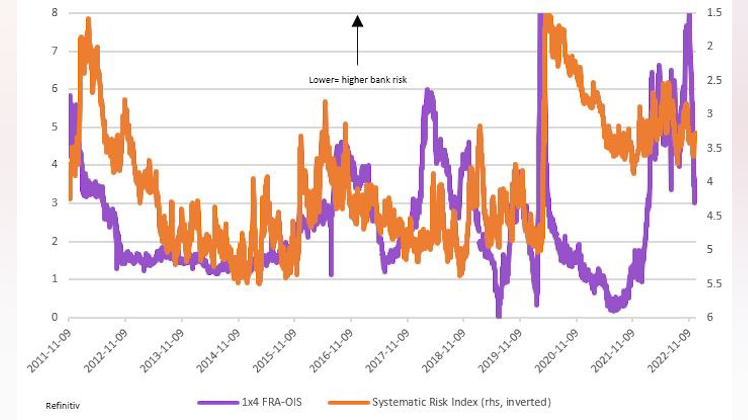
Bank Stress
Looking at the FRA-OIS a proxy for bank risk against the systematic risk index also a proxy for stress within the banking sector we have seen pressures ease. However, pressure still remains relatively elevated from a historical standpoint. This could depending on how the FRA-OIS moves could put more stress on the banking sector.
post media

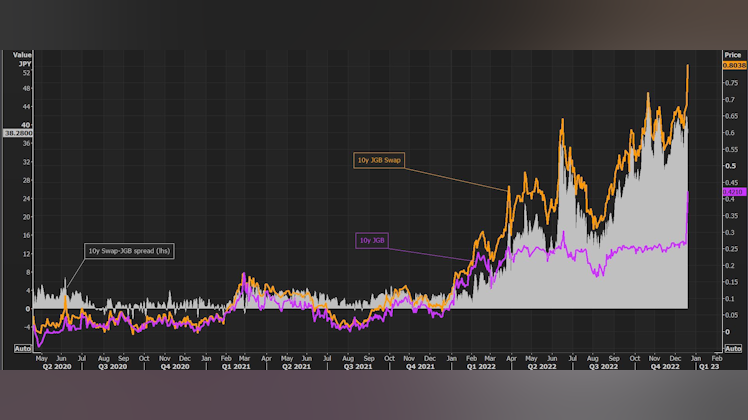
Japan Raises Cap from 25 to 50bps
Lets talk Japan 10y swap been trading wide to 10y JGB since 25bps cap began. Since September 10y swap has been at around 50bps, signaling no one in cash market (denoted by swap) was buying that the 25bps cap would remain. Seem cash market doesn't buy 50bps either. This should not come as a surprise that the cap was raised based on where the 10y swap had been trading and what the cash market was signaling in terms of cap being raised, and not maintaining it's 25bps control nor does it think 50bps would remain either.
post media

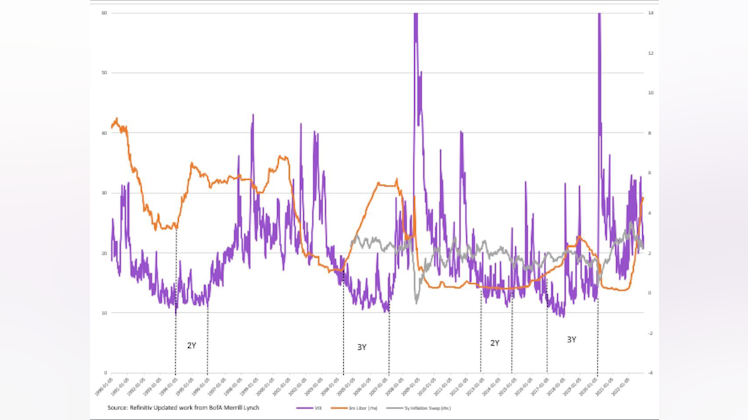
Rates lead equity vol by 2y
This is an interesting graph. I updated it from BofA research. This is looking at rate cycle vs equity vol. rate cycle leads by about 2y. Now “smoothed vol.” is important from a financial stability standpoint.

Higher fx vol and asset vol can cause a lot of stress in terms of assets held whether it be sublt2 or other ratios, this can cause VaR extensions or even extensions of risk weighted assets.

Now why does equity vol spike when rates fall, usually it comes on the backs of shifts in monetary policy. Now with the massive parabolic move in libor we would expect higher equity vol soon, and this could come on the back of slowing economy. With many leading indicators pointing downwards, this does not pose well for let’s say economic growth. Times fed has hiked during a slowdown is n=1 maybe n=2 but usually they cut. So we would expect rates to fall and equity vol to spike due to economic uncertainty.
post media

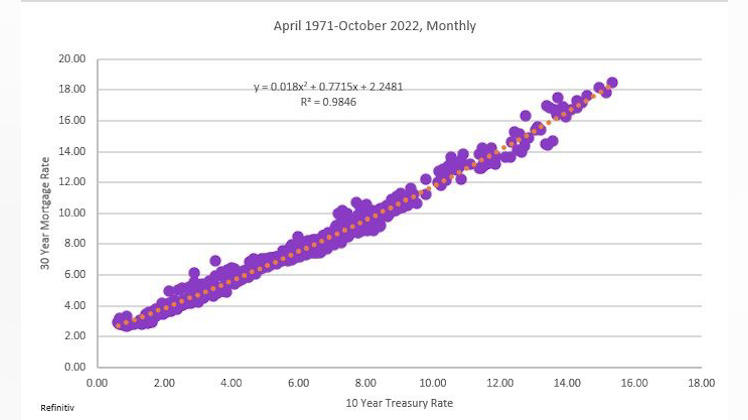
Want to Know Where Mortgage Rates Are Going? Watch 10-year
The relationship between the 10-year treasury bill, and 30-year mortgage is almost a near perfect fit. Currently 10-year term premiums are negative, this would imply the bond markets are still holding on to the deflationary, and lower rate narrative. Which would also imply at some point mortgage rates will ease.
post media

Love the visual— and interesting to see this uses data going back to 1971, which included a time period when 30 year mortgagee rates were at 18% 🤯
Add a comment…
Watchlist
Something went wrong while loading your statistics.
Please try again later.
Already have an account?