Trending Assets
Top investors this month
Trending Assets
Top investors this month
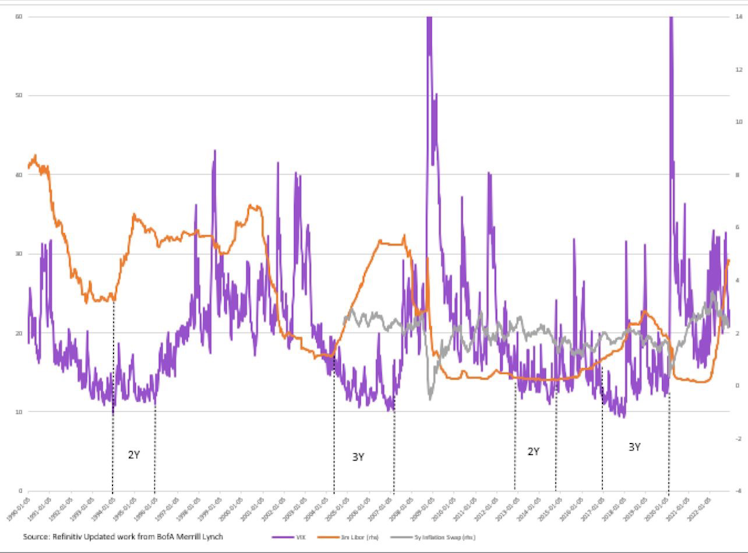
Rates lead equity vol by 2y
This is an interesting graph. I updated it from BofA research. This is looking at rate cycle vs equity vol. rate cycle leads by about 2y. Now “smoothed vol.” is important from a financial stability standpoint.
Higher fx vol and asset vol can cause a lot of stress in terms of assets held whether it be sublt2 or other ratios, this can cause VaR extensions or even extensions of risk weighted assets.
Now why does equity vol spike when rates fall, usually it comes on the backs of shifts in monetary policy. Now with the massive parabolic move in libor we would expect higher equity vol soon, and this could come on the back of slowing economy. With many leading indicators pointing downwards, this does not pose well for let’s say economic growth. Times fed has hiked during a slowdown is n=1 maybe n=2 but usually they cut. So we would expect rates to fall and equity vol to spike due to economic uncertainty.

Already have an account?