Trending Assets
Top investors this month
Trending Assets
Top investors this month
$BABA Technical Analysis Lesson
I am going to teach you how I use Technical Analysis to determine when to buy and when NOT to buy. While $BABA has grown exponentially over the past 5 years, its stock price is flat. Why is this?
Some will say its all due to the geo-political risk associated with China, the disappearance of Jack Ma, Covid, and many other reasons. The fundamental analysis is stronger than it was 5 years ago which makes it an incredible opportunity for a long term investment.
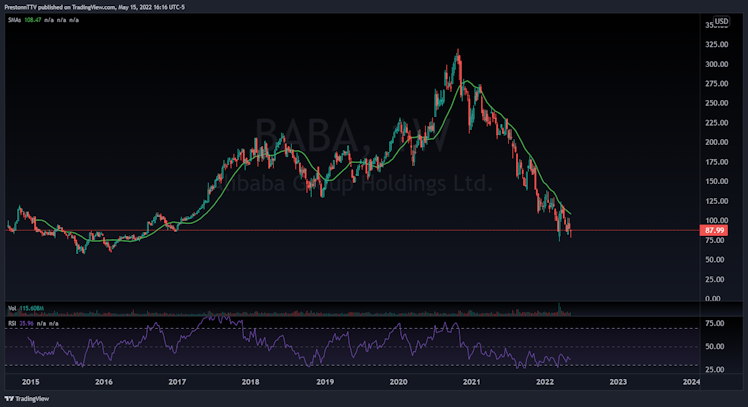
$BABA, in my opinion, is a tightly coiled spring that is ready to explode over the next 5 years. Now, as shown below, the weekly 20SMA has consistently acted as resistance, so any one who has been DCAing into this name is buying the dip wrong.
As a technical analysis investor, I wait until we finally breach the 20SMA on the weekly and see it forming support instead of resistance. The moment I see this, its time to enter my long term portfolio position.
I have NO idea when it will breach this level, it could be in the next 4 weeks, it could be the end of 2022, but TA shows me to NOT buy into this name until it is breached.
You can DCA all you want into this name, but I let the chart tell me when to buy and when not to buy. Right now, we are in DO NOT buy until it breaches.
I hope this helps educate you on buying the dip properly vs buying the dip blindly.
Already have an account?