Trending Assets
Top investors this month
Trending Assets
Top investors this month
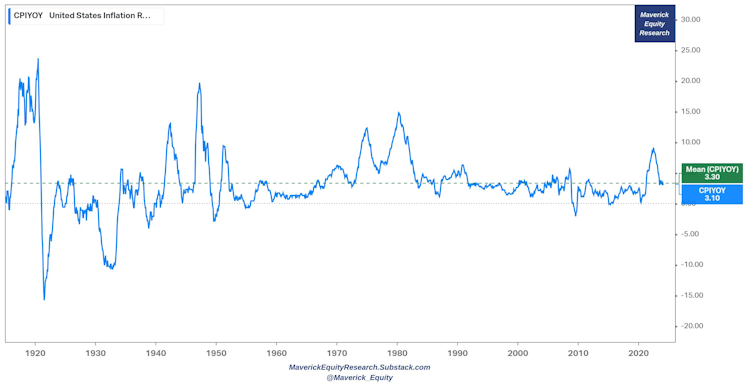
110 years of Inflation in one Maverick chart 👇
👉 average across 110 years = 3.3% (green)
👉 current value is below = 3.1% (blue)
Can we say we reached the target in a way already?
Food for thought for the weekend ... enjoy!
P.S. working on a dedicated special Inflation report
My focus are naturally equities, but inflation is a key variable via interest rates for valuation etc.
Already have an account?