Trending Assets
Top investors this month
Trending Assets
Top investors this month
What Moves Air Products and Chemicals $APD?
Air Products and Chemicals ($APD) is currently the third best performing stock in my portfolio with a return of 17.9% since starting the position in March. $APD’s price action, like most of the market, was tough for the first half of this year. However, their bounce back in the last month has caught my attention as the stock has moved higher with more strength than my other positions. They had a stellar Q3 earnings report where sales jumped by nearly 22% year-over-year, however, their net income margin fell by about 2% as inflationary pressures continue to challenge the business. The company issued guidance for maintaining their full year EPS guidance of $10.20 - $10.40 which is a 14% increase on last year. Great guidance, great sales growth, a nice dividend, healthy balance sheet, it all looks good! But being the macro-nerd that I am I felt like I needed to understand the business and industry more in order to grasp what’s behind this movement.
$APD sells industrial gases (nitrogen, hydrogen, oxygen, helium, carbon dioxide and monoxide, and other general and specialty gases) and the equipment involved in the production, refining, and processing of the gases. These types of gases are essentially commodities. These gases are usually a small fraction of the costs of supply chain and manufacturing businesses and for that reason those consumers are often willing to pay a premium for long-term contracts for sustained production. Demand for industrial gases are obviously strongly related to industrial production. These gases are used everywhere in all types of applications like cooling, heat treating, melting, welding, pH control, oxygen enrichment, liquefaction, fueling, blanketing, aeration, and many many more. The industry continues to grow with industrial production and has promising future growth potential in the form of gasification, green hydrogen, and carbon capture.
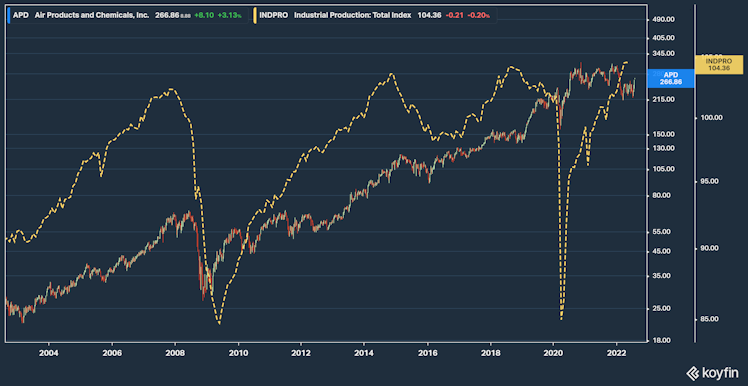
These gases are heavily used in industrial manufacturing. The above chart shows the stock price of $APD with overlays of the Industrial Production: Total Index. That data comes from a Federal Reserve statistical release and is updated on a monthly basis. The index measures the output of manufacturing in the US and can generally be used to gauge consumer spending, inflation, and economic growth. The index measures the change in the production output of major market groups and industry groups including factories, mines, and utilities. As you can see in the graph, in times of economic growth, the index is well above the price action of $APD. However, in economic downturns such as the Great Recession and the COVID crash, you can see that the industrial production index falls sharply underneath the stock price of $APD. The index last crossed under $APD in February of 2020 and only recently crossed back above two years later in February of 2022. If history is any indicator, when the Industrial Production index trends upwards, $APD follows suit by a small distance. Now that we are a few months past the last parity, it looks as if that trend may be in a position to continue!
Obviously, there’s a lot more going on in the macro environment of our economy and this stock, however I thought this trend was interesting and worth sharing! Would love to hear your thoughts and questions in the comments!
Already have an account?