Trending Assets
Top investors this month
Trending Assets
Top investors this month
SLT Core Portfolio: The Power of Quality Investing
We have performed a quick analysis of risk-return characteristics of the Quality factor compared to the Value factor and the market in general. We have used the following ETFs and indices as proxies:
- iShares MSCI USA Quality Factor ETF (QUAL)
- iShares MSCI USA Value Factor ETF (VLUE)
- S&P 500 Index
- Dow Jones Industrial Average Index
The below graph shows that the Quality factor provided the best absolute return over the last decade or so (August 2013 until end of July 2022), including Covid-19 and 1H 2022 bear markets. The iShares MSCI USA Quality Factor ETF returned c.180% over the period outperforming by roughly 67%, 38%, and 78% the iShares MSCI USA Quality Factor ETF, S&P 500 Index, and Dow Jones Industrial Average Index respectively.
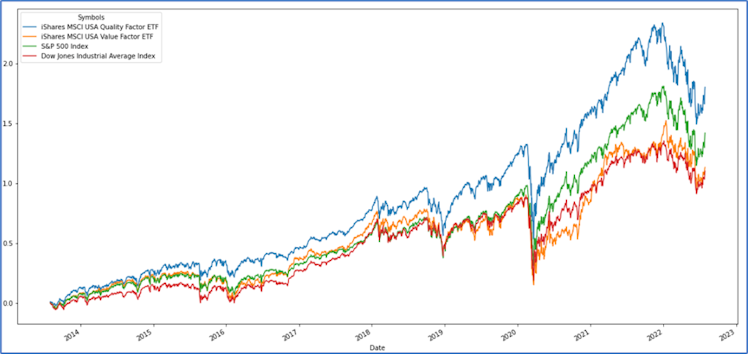
Source: SLT Research / Yahoo! Finance API.
From a risk-return perspective, the below table summarizes key return and risk metrics.
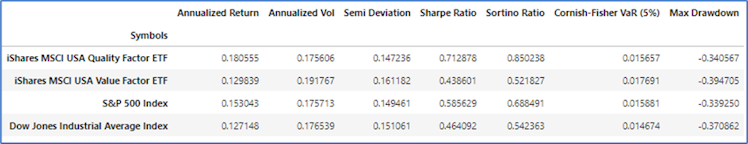
Source: SLT Research Python Script | risk-free rate: 2.6%.
The Quality factor had the highest annualized return and lower volatility of the group over the period. Hence, it posted the highest Sharpe ratio, the return earned in excess of the risk-free
rate per unit of volatility. The Quality factor also offered an interesting downside protection translated by a Sortino ratio substantially higher than other proxies in the group and a lower semi-deviation. The Sortino ratio is an alternative to the Sharpe ratio computed using only standard deviation (volatility) of negative returns, called the semi-deviation. Surprisingly, the Quality factor exhibits a lower maximum drawdown than both the Value factor and the Dow Jones Industrial Average Index.
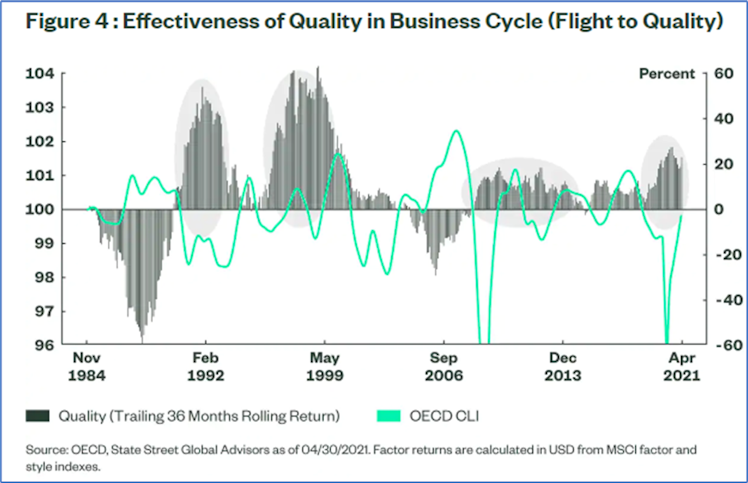
To conclude, the below graph demonstrates the effectiveness of the Quality factor to protect capital during periods of recession.
Already have an account?