Trending Assets
Top investors this month
Trending Assets
Top investors this month
$KLAC Deep Dive - Part 2
We hope that you enjoyed reading the first part of our $KLAC deep dive report. In the second and last part of our deep dive we capture Risks, Competitive Positioning, Opportunities, a high level DCF calculation and our Remarks (sections 5-9). If you enjoy the second part, make sure that you share it to social media to spread the word. In case you have any questions feel free to reach out.
For transparency reasons, we should also note that $KLAC accounts for 4% of our portfolio with an average cost price of $336.53.
In this post we will share in full the Valuation section:
Valuation
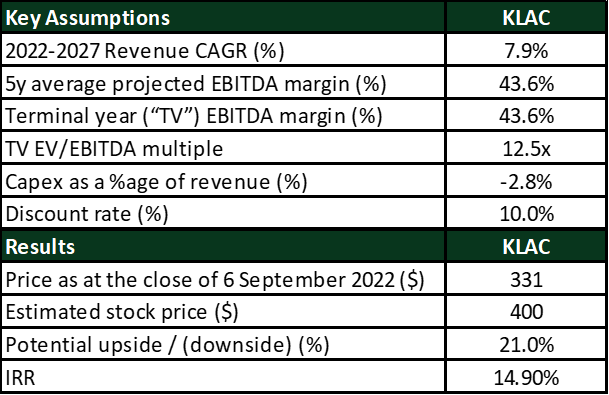
The stock price as of 6th of September 2022 stands at $330.58 and is down by 23.14% YTD. The market cap of the Company stands at $46.88B and trades at an EV/EBITDA Trailing Twelve Months (“TTM”) multiple of 12.9x compared to its 5 year average of 14.6x. Based on our DCF valuation the estimated price of KLAC stands at $400, 21.0% higher than its current price level with a resulting IRR over a 5-year period of 14.9%.
Source: StockOpine analysis
To estimate the fair value of KLAC we assumed a revenue CAGR of 7.9% based on both analysts’ consensus and Management expectations. The resulting revenue for FY26 (c. $11.9B) and FY27 (c. $13.5B) is at the lower end of Management’s target of $14B +/-$500M of CY26. We consider this assumption to be fair given the estimated WFE CAGR of 7.5% for the period 2021 – 2026.
In terms of profitability, we used an average projected EBITDA margin and terminal EBITDA margin of 43.6% which is higher than the 5 year historic average of 39.1% and similar to the FY22 EBITDA margin of 43.6%. The basis of the margin improvement is the targeted Non-GAAP incremental operating margin of (40% to 50%) and the leverage that the Company expects to have on its SG&A expenses.
To derive the free cash flows to the firm we deducted projected Capex requirements based on the historic average and adjusted upwards by 0.5% to be closer to the 3%-4% range disclosed at the Investor Day.
In respect to the terminal EV/EBITDA multiple, it is assumed to be around 12.5x which is lower than its current multiple of 12.9x and its 5-year average 14.6x. Despite this, the terminal multiple is higher than the median 10.7x multiple of the selected peers in the semiconductor equipment industry but lower than their 5-year median of 14.3x. The quality of its business justifies a higher multiple than the median of its peers, although we tried not to be aggressive in our estimates.
To calculate the value per share we used the minimum required return that we aim to obtain from our investments (i.e., 10%) under the current environment, adjusted for net debt and non-operating assets / liabilities identified and thereafter divided the resulting value by the number of shares.
Based on the above calculations and assumptions used (which of course may not materialise at all), we reach a value per share of $400 with a potential upside of 21.0% and a resulting IRR over a 5-year period of 14.9%.
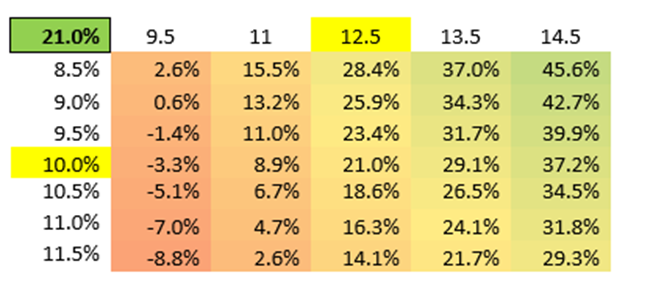
Sensitivity analysis
The below table gives an indication of the potential upside/downside %age compared to the current price ($330.58 as of 6th of September) when the terminal multiple and the discount rate are changed.
Source: StockOpine analysis
Disclaimer: Not a financial advice. Do your own due diligence.
stockopine.substack.com
KLA Corporation - Deep Dive - Part (2/2)
KLA was formed in 1997 through the merger of KLA Instruments Corporation and Tencor Instruments and is a leading supplier of process control and yield management solutions and services for the semiconductor and related electronics industries.
Already have an account?