Trending Assets
Top investors this month
Trending Assets
Top investors this month
Outlook for 2H22
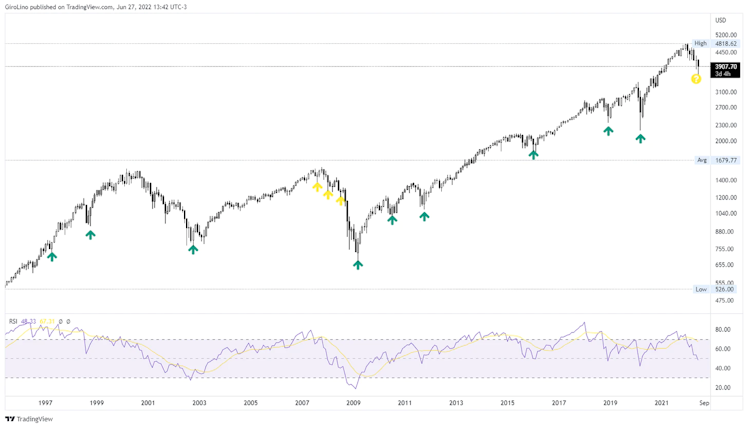
For the 2H22, there are a few charts investors should keep warry of. The S&P 500 Index tries to build upon the initial rebound from the extreme oversold conditions realized last week.
The deeply oversold conditions and bullish momentum divergence signals already in place imply an increased probability for additional upside into July.
We recognize the divergence only plays for weekly charts, nevertheless. As in 2007, we should keep cautious without the confirmation of the monthly chart.
Slowly, we’re turning our attention back to gold companies. In January, we wrote about how the FED suggested that near-term risk increased, and prices should adjust to that given the uncertain path ahead, indicating consecutive hikes ahead.
Chair Powell clarified that FED’s job isn’t to set a floor to stock prices — the so-called FED Put. The problem is that, historically, FED’s decisions are influenced by stock prices and volatility.
In the following month, we wrote about the spread between 10yr and 2yrs maturity USTs have been pricing lower growth ahead.
Historically, if the curve stays under pressure, the FED creates the narrative that lower growth will help with inflationary pressure and, therefore, overblowing the hike's narrative.
In our opinion, and it’s no secret, the FED is screwed. Either the bond market will collapse with skyrocketing yields, or the currency will vanish because of money printing to support bond purchases.
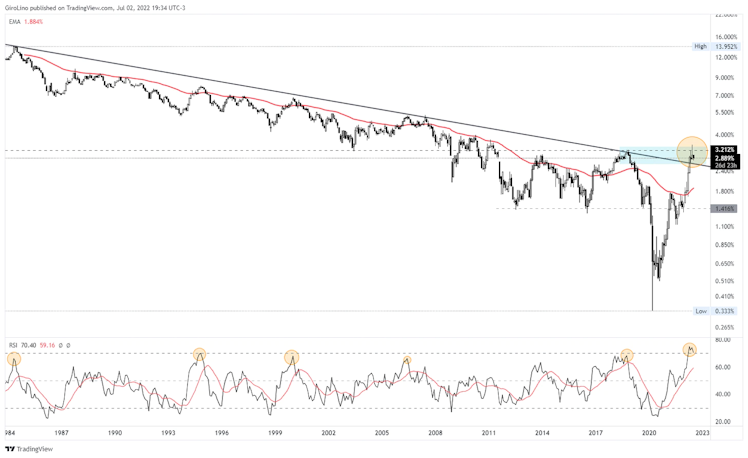
The market has given the first sign we need.
After significant price moves throughout the year, the UST10Y closed well below the intra-month high, forming a pattern in the monthly chart called “inverted hammer.”
giro.substack.com
Food for Thought #3
Your Sunday morning meditation 2022-02-06
Already have an account?