Trending Assets
Top investors this month
Trending Assets
Top investors this month
‘Feature Flagger’ for Koyfin – 'Drawdown % from peak'
Koyfin is an excellent tool for investors to research stocks & other asset classes. Koyfin covers equities, ETFs, mutual funds, forex, bonds, etc.
A couple of days ago, Steve Matt @interrobangbros has just asked a question regarding how people can see a percent off all-time high chart (similar to what YCharts has as a functionality). Such question seems to have been posted before in the past in the feedback forums but, unfortunately, with no responses.
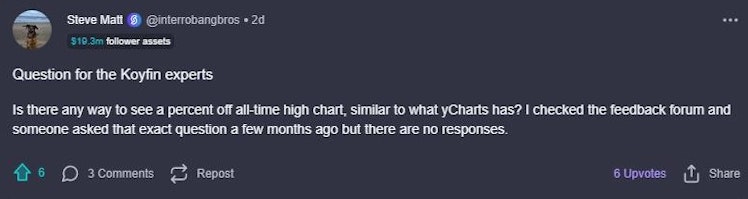
Source: Commonstock; Steve Matt; Todor Kostov
Having used Koyfin for a couple of years, I am happy to say that there is such a functionality and, actually,
it gives the flexible choices, for us as users, to dynamically play around and choose different periods
for such query – '1 month', '3 months', '6 months', 'YTD', '1Y', '3Y', '5Y', '10Y', '20Y' and 'ALL'.
This functionality is called ‘Drawdown % from peak’ and below are the steps to follow if you want to use it:
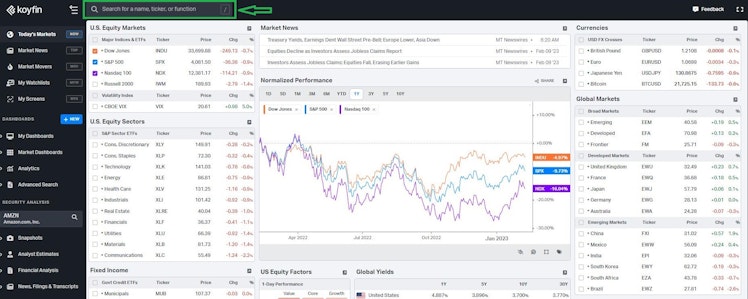
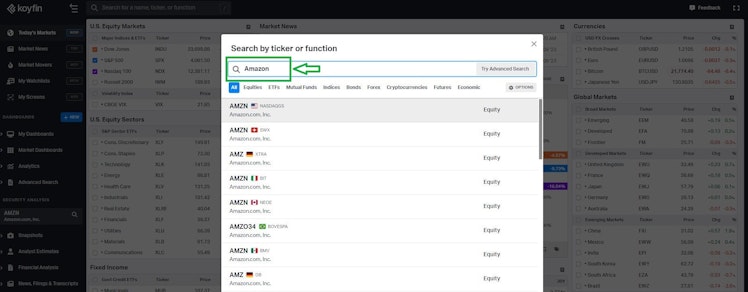
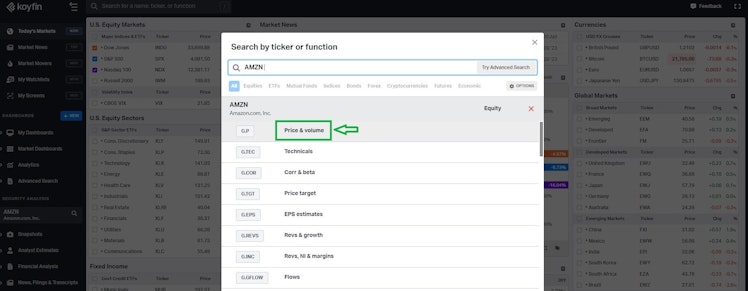
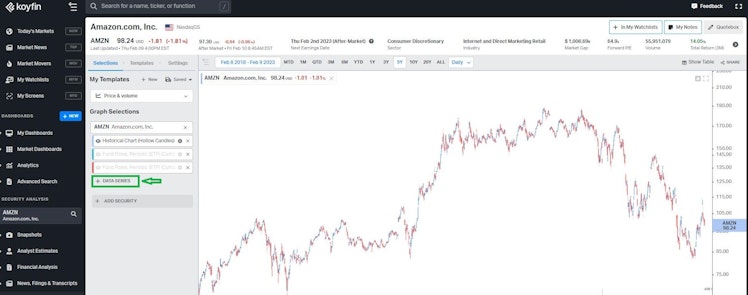
- Go to the ‘Home’ screen of Koyfin. On the top left corner there is a ‘Search Box’ where you can type the ‘Company’ or the ‘Ticker Symbol‘ you are interested in, press ‘Enter’ and choose ‘Price & Volume’ . For this example, I have chosen Amazon $AMZN.
Source: Koyfin; Todor Kostov
Source: Koyfin; Todor Kostov
Source: Koyfin; Todor Kostov
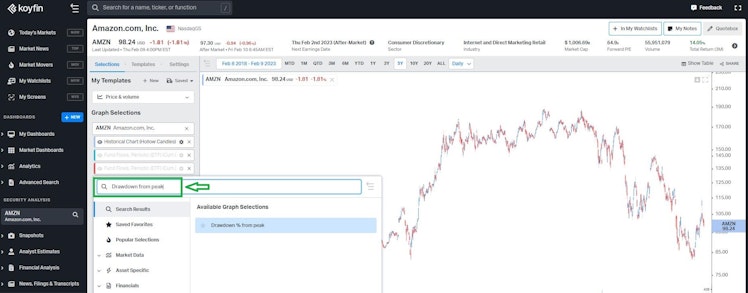
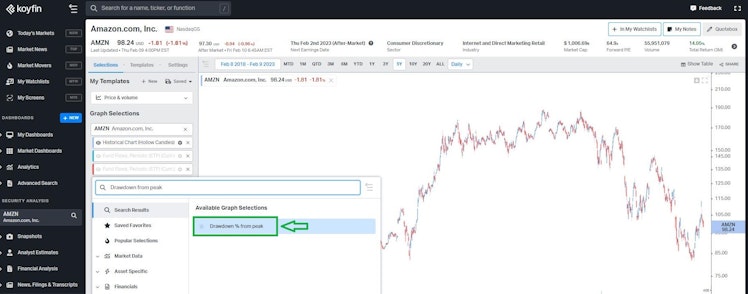
- Once you land on the ‘Price & Volume’ screen, expand the ‘DATA SERIES’ tab (in the middle of the screen on the left-hand side). In the ‘Search Box’ type ‘Drawdown from peak’ and choose the only ‘Available Graph Selections’ option you see from the pop-up small window, i.e. ‘Drawdown % from peak’.
Source: Koyfin; Todor Kostov
Source: Koyfin; Todor Kostov
Source: Koyfin; Todor Kostov
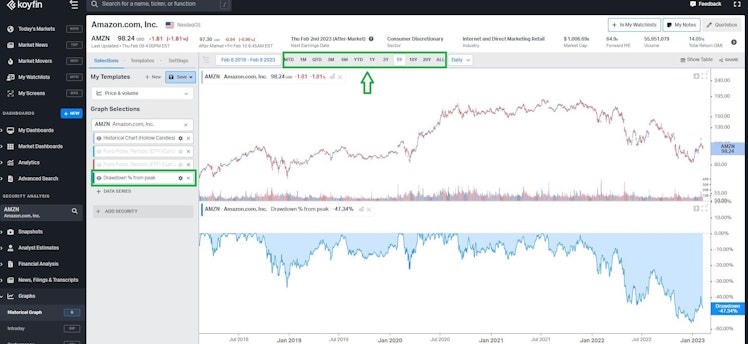
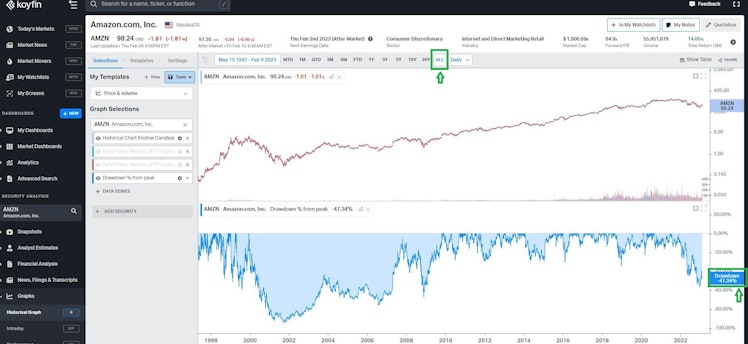
- Finally, you have landed on a screen showing ‘Historical Chart’ and ‘Drawdown % from peak’ for the selected security, in this example Amazon $AMZN. At the top half and in the middle of the screen, you can easily navigate through different periods of interest when doing your analysis – from ‘MTD’ all the way to ‘ALL’. If choosing ‘ALL’, this will equate the result which you will get on YCharts for ‘percent of all-time high chart’. Currently, for the example I have given with Amazon $AMZN , this will translate into -47.34% drawdown from all-time high (as of 10 Feb 2023 pre-market prices).
Source: Koyfin; Todor Kostov
Source: Koyfin; Todor Kostov
I hope all users will find this post helpful and I am happy to offer 10% off the first year for a premium account if you follow the link below and sign up with Koyfin:
Koyfin
Comprehensive financial data analysis - Koyfin
Koyfin provides tools for investors to research stocks & other asset classes. Koyfin covers equities, ETFs, mutual funds, forex, bonds, etc.
Already have an account?