Trending Assets
Top investors this month
Trending Assets
Top investors this month
Net Liquidity, Spiking Bond Yields, Could AI Fuel A(nother) Stock Market Bubble?
Net Liquidity
Back on May 7, I made a prediction that Treasury issuance to refill the Treasury General Account (TGA — America’s checking account) was going to suck liquidity out of the market and force a drawdown in stocks.
Wrong!
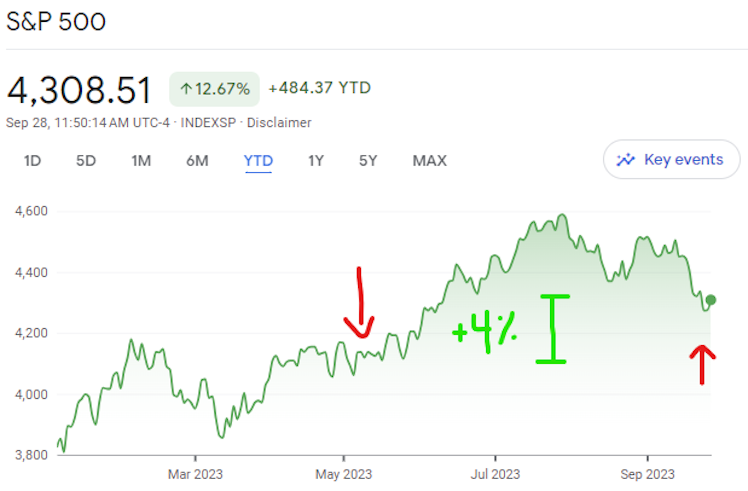
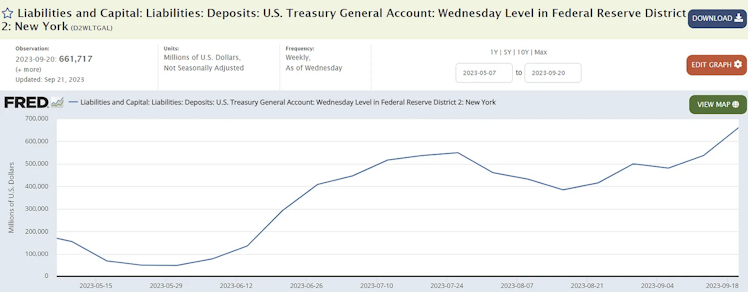
Stocks proceeded to go on a face-ripping summer rally, driven by Nvidia NVDA 0.00%↑ and the rest of the “Magnificent Seven,” before peaking at the end of July and giving back some of the rally here over the last two months. Meanwhile, the TGA has been rapidly refilled as expected, increasing by $500 billion since May:
And at the same time the Fed has shrunk its balance sheet by another $500 billion:
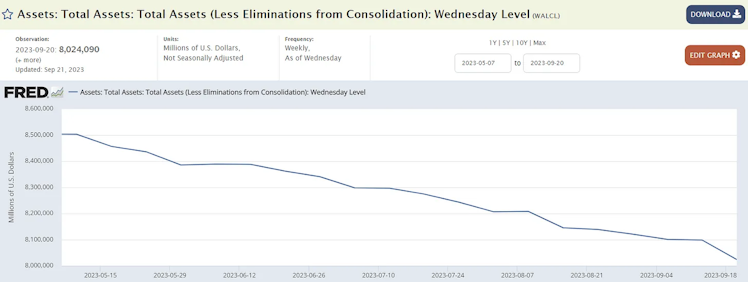
So that’s net $1 trillion in liquidity that’s been sucked out of the market by the Fed and the TGA in the span of four months, yet risk assets have continued to rally in the face of this liquidity drain.
What explains this? What did I get wrong?
The Overnight Reverse Repo Facility
Known as the “ON RRP,” this is the missing piece of the puzzle. It’s a facility where money market funds, commercial banks and other institutions can borrow or lend overnight directly with the Fed at the Fed Funds Rate. Because of it’s (assumed) lack of duration and counter-party risk, it’s a popular choice of investment for many money market funds (MMFs), which have seen mega inflows this year as investors eschew bank deposits earning 0% interest for the ~5% “risk-free” return available in MMFs.
Back in May, my prediction of a summer stock market drawdown was based on the logic that the Treasury expected to borrow a net of $1 trillion over Q2 and Q3, and with the Fed engaging in QT, the domestic commercial banking sector already sucking wind and borrowing from the BTFP to stay liquid, and foreign governments reducing their holdings of U.S. Treasuries, that $1 trillion was going to have to come from somewhere and that somewhere was going to have to be the private sector.
Well, it did, kind of. It came from the ON RRP:
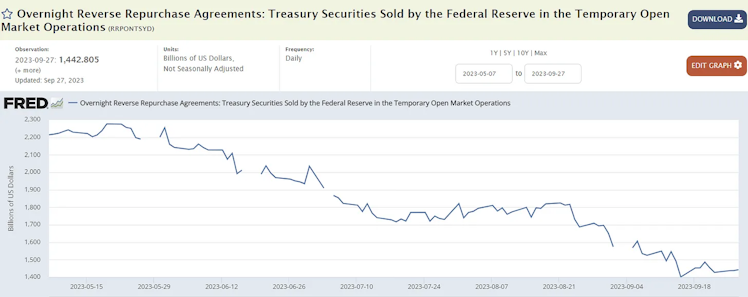
That’s about a $800 billion drawdown in the ON RRP, which nearly matches the $1 trillion combined liquidity draw from the TGA and the Fed balance sheet over the same period.
So the net impact to total market liquidity since May has been about negative $200 billion, a far cry from the $1 trillion I hypothesized would be needed.
Bills vs. Notes vs. Bonds: Tenor Matters
What I failed to consider in May is at what tenor would the Treasury seek to borrow at to refill their coffers, and how would that impact where the source of funds would come from?
Treasury Bills are short-term (less than one year) securities, maturing in 13, 26, or 52 weeks from issue date.
Treasury Notes are medium-term securities, maturing between 2-10 years.
Treasury Bonds are long-term securities, maturing between 10-30 years.
If the Treasury issues notes or bonds, MMFs are not a good candidate to purchase the debt because they cannot take that much duration risk. That money must come from medium and long-term lenders/investors, which usually means foreign governments, pensions, and stock market investors.
However, if the Teasury issues primarily bills, money market funds are a candidate to purchase the debt because they can afford to take on a little duration risk to earn a little bit more yield. They can effectively swap a portion of their funds parked at the reverse repo for T-Bills, so long as they keep enough liquid to honor fund redemptions.
Well, over the past four months that’s exactly what’s happened. The Treasury has decided to primarily tap money markets and the reverse repo to refill the TGA by issuing bills, and so far has been reluctant to borrow at the medium- and long-end of the curve despite the fact that it costs them more to borrow short-term (currently ~5.6%) than medium- or long-term (currently ~4.75%). This is the “inverted yield curve” you keep hearing about:
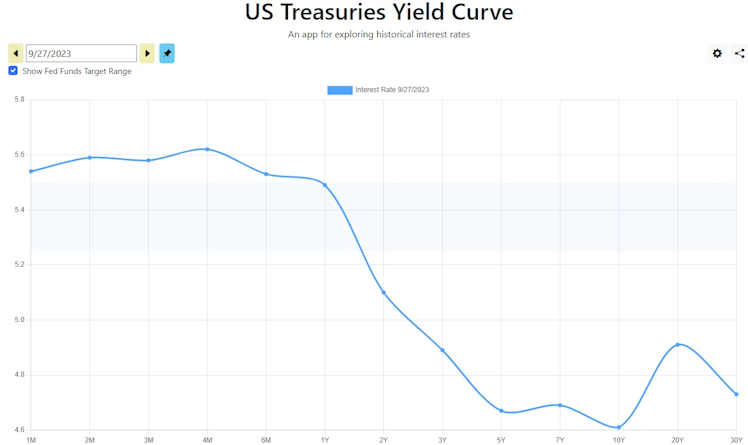
Why would the treasury willingly choose to borrow at higher rates? Well, they might expect long-term rates to come down in the future and not want to lock-in their cost of 10-30 year debt at cycle highs, OR (gasp!) the “deepest, most liquid market in the world” (U.S. Treasuries) might not be as deep and liquid as it is commonly assumed — meaning, there aren’t enough buyers of 10-30 year bonds at 4.75% and the Treasury knows the only purchasers of their debt are at the short-end.
Whatever the answer, the long and the short of it is that so far money market investors have been funding the TGA refill as opposed to stock market investors, and net market liquidity has remained flattish to slightly down over the summer as opposed to being significantly down. In my view this is what has allowed the stock market rally to continue, along with Nvidia selling enough A100s to power a small country with heat dissipation alone (although they might not have anything to drink!).
So, the questions now are: can this continue? For how long? What changes it?
September 2019 U.S. Repo Market Malfunction
A long, long time ago, in the before times, we experienced a breakdown of sorts in the repo market. On September 16 and 17, 2019, overnight money market rates spiked from the Fed’s target range of 2.25% to over 10%. To my knowledge this type of move was unprecendented, and is believed to have been caused by a shortage of cash due to corporate tax payments and an increase in net treasury issuance. Tax payments plus $54 billion of long-term treasury debt settling on September 16 caused reserves in the banking system to decline by about $120 billion over two business days. The volatility in the overnight rate prompted to Fed to inject $75 billion of liquidity into the repo markets on Tuesday, September 17 and it continued to do so each day for the remainder of the week, resulting in a total $300 billion liquidity injection over four days. The S&P 500 fell 4% over the final two weeks in September on repo market uncertainty and fear.
To further address the apparent lack of liquidity in the system, the Fed announced on October 11, 2019 that it would restart QE and buy $60 billion of T-bills monthly through Q2 2020 (of course we never got that far without far greater Fed intervention needed due to COVID). The Fed’s actions ignited a 15% rally in the S&P 500 from October 2019 - February 2020, before COVID ravaged global markets.
A Fed post-mortem on the entire episode can be found here.
Okay great, who cares?
Well, California tax payers were granted an emergency extension for filing and paying their 2022 taxes due to winter storms. October 16 is tax day this year if you live or do business in California.
And a lot of people live and do business in California, including many of the aforementioned MAG7.
I haven’t seen any estimates on how much in aggregate taxes California individuals and businesses are expected to pay (read: how much money they’re expected to drain from the system) on October 16, but a quick scan of MAG7 balance sheets reveals $25 billion coming from those seven entities alone.
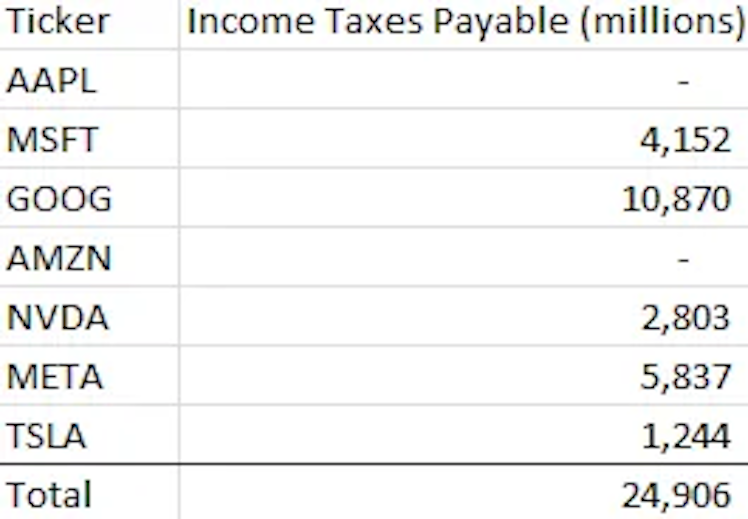
I can’t be sure all of that is due October 16, but Google, Nvidia and Meta are domiciled in California and so I think at least a majority of those taxes will be paid October 16, accounting for ~$20 billion from just four, albeit four very large, corporations. Compare this to the $66 billion tax payment that caused stress in September 2019.
Add on top that individual taxes, and that student loan repayments are restarting in October for the first time since the pandemic struck, and you’ve likely got a material amount of reserves coming out of an already stressed banking system.
Now, you would the Treasury might have learned from 2019 and try and go light on issuance through this period, just to be safe. Those tax payments are going straight into their account, after all! Time will tell, and the smart money probably isn’t on the same exact mix of forces causing a repo market malfunction as last time, but I’m watching the Treasury’s announcements of future auctions and if they announce a large amount of issuance in the mid-October time frame, I’m going to be inclined to lean a little harder on the sell button.
That’s risk factor #1 and has a very tight window. We’ll know whether this is a problem or not in three weeks time.
Risk factor #2 is that, at some point, the Treasury will need to start issuing bonds instead of bills.
The risk, though, of issuing more debt at the long-end of the curve is that you don’t find bidders for that debt and you have a failed auction. This is what happened in the UK Gilts market a year ago this month, and caused the Bank of England to restart QE.
Much like the overnight rate spiked from 2% to 10% in days in 2019, I’m wary we could see this tightening cycle end with 30-year bond yields spiking from 5% to 10%. This would very probably cause a) a large stock market drawdown and b) the Fed to step in and do QE to bring bond yields back down. This would be the green light to go all-in on stocks I’ve been waiting for.
This is essentially my thesis from May eventually playing out. I’m watching the upcoming auctions for large bond issuance to potentially cause a repricing (read: rates up stocks down) in markets.
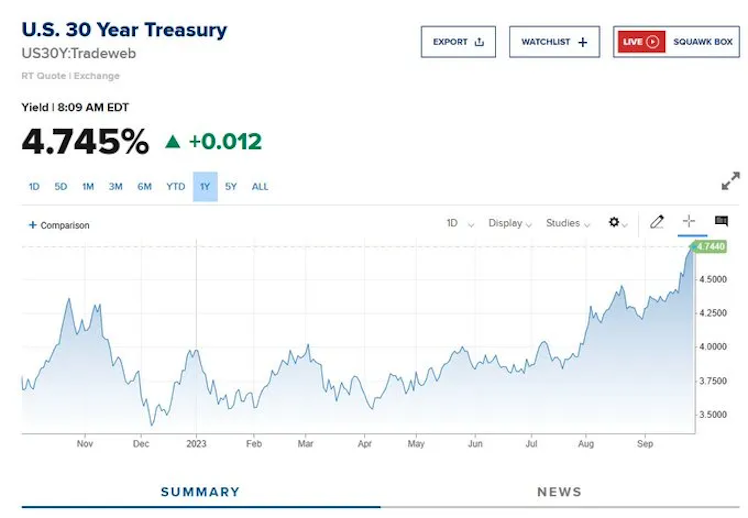
Indeed, as I write this, rates are breaking out to new highs:
Maybe None of it Matters; AI to the Moon
Now, doom porn that sounds smart is one thing, and actually making money is another.
Bears sound smart, bulls make money.
I thought I had a compelling thesis for why stocks were due for a drawdown back in May, and here we are with the S&P up 4% and the Nasdaq up about 11% from May 7 to Septmeber 28 close. I latched onto the TGA rebuild narrative, but missed that it would be funded by the repo markets and be a net neutral event to overall market liquidity.
About two weeks after I penned that thesis, NVDA 0.00%↑ reported the best quarter in history and sent the market into an AI-fueled summer rally that damn near sent the market to new all-time highs before topping out a couple weeks ago.
For full transparency, I used the 2023 YTD rally to bring down exposure and raise cash in June, and hedged 100% of my remaining net long equity exposure with at-the-money QQQ puts bought on June 15 and June 29, for expiration date October 20, 2023. At the time I felt like the October 20 expiry got me through the anticipated TGA rebuild, through September quad-witching, and through the mutual fund year-end and tax-loss harvesting period. If it didn’t happen by then, my thesis was probably wrong.
My current asset allocation looks like this:
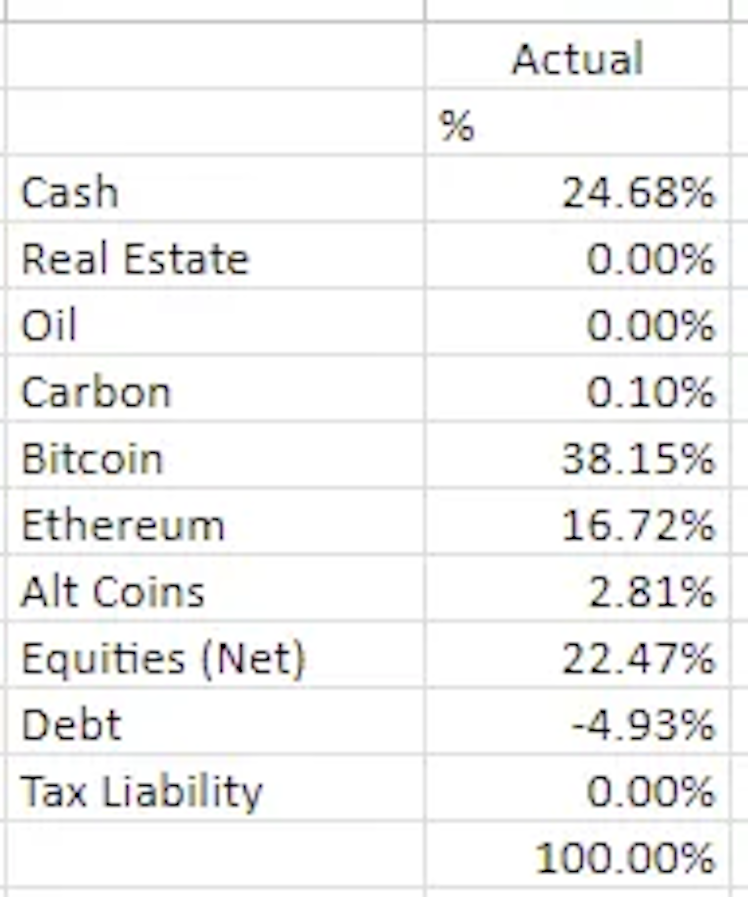
As mentioned, I’m currently hedging my net equity exposure out with options. My portfolio beta is 0.31 so I’m still biased long.
I was feeling like an idiot for most of the summer as the QQQs ripped in my face, before the pullback of the last two weeks took away a bit (not all!) of the sting. I plan on holding my puts to expiry unless they pay off before then. You can definitely accuse me of thesis creep, but I picked October expiry for a reason and I’m sticking to it in light of the new information I’ve laid out above.
Nonetheless, over the summer I was cursing myself for trying to time a short-term market plumbing gyration while a dot-com level generational technology and narrative in AI popped up right in my face and sent stocks ripping. It didn’t even just appear out of nowhere either: ChatGPT was released last November and Druckenmiller was touting he was long NVDA since Q1. Then in the middle of it all, there was the discovery of a potential room-temp superconductor!?!? Blimey!
What happens if we wake up one day and the Teslas are actually driving themselves?
The point is that I think the inexorable march of technology will continue to send the stock market higher over time in real terms and it’s hard to time just when a new technology is going to unfold or narrative is going to take hold. I’m now very open to the idea that AI could prove to fuel a stock market bubble of similar or larger magnitude than the dot-com bubble — why not?
One of the hallmarks of the dot-com bubble, otherwise known as the telecom and tech bubble, was the tremendous overbuild of infrastructure and capacity before there were really any scaled applications to turn that capacity into consumer value. But, the overbuild, while creating a boom-bust cycle in the short-term, brought compute, storage and bandwidth costs down to the point where there was a foundation for the Googles, Amazons, and Netflixes of tomorrow to be built upon. I think a similar thing is happening in AI right now, as Sequoia has elegantly put it.
Combine this with the ongoing, inevitable (if uneven) debasement of fiat money sending real assets higher in nominal terms, and I think you definitely want to be biased long if not levered long stocks most of the time.
On the other hand, there is no precedent for a “soft-landing” after a rate-hiking cycle, and we’re in one of the most dramatic in history, following one of the biggest asset “bubbles” in history post-covid. I’m also very open to the idea that this ends with a failed treasury auction and the long end spiking to 10%, sending stocks into a sharp tailspin.
Shrug. This game is hard.
My base case is still at some point (soon-ish) we get a spike in bond yields and a sharp drawdown in stocks, forcing the Fed to step back in with QE and away we go.
The Fed tells the market when it’s going to do QT.
The market tells the Fed when it’s going to do QE.
Thus the large 25% cash position — 5.5% return in money markets isn’t the worst place to hide while sitting and watching how things play out. I’m also going to weigh a short TLT and/or long PFIX position over the coming days and weeks.
So, in sum, I think the can has been kicked and we’re right back where we were in May but with a little added AI narrative overhang. What I think I learned over the summer is, going forward if I want to hedge/be short something, I don’t want it to be the QQQs. I picked QQQ puts back in June because a) I thought the QQQs would be the most rate sensitive index and b) they had just enjoyed a big run on the back of NVDA.
I’m going to let those ride, but on the back end of all this (QE infinity) that’s the index I want to be long. Even in a higher-for-longer scenario (not my base case), I think high real rates are a rich-get-richer phenomenon. MAG7 has $600 billion in cash sitting on the balance sheet earning 5.5%. That’s $33 billion a year of interest income on top of $270 billion in earnings last year, or a 12% tailwind to earnings absent any growth or margin leverage.
While most of the Russell 2000 is burdened by higher rates, MAG7 is printing.
Moreover, I think AI is potentially a centralizing technology. If AI is fundamentally a compute + data game, nobody has anywhere near the compute + data as MAG7.
Sequoia Capital
AI’s $200B Question
GPU capacity is getting overbuilt. Long-term, this is good for startups. Short-term, things could get messy. Follow the GPUs to find out why.
Already have an account?