Trending Assets
Top investors this month
Trending Assets
Top investors this month
Mastering Optimal Trade Entry with Python and Fibonacci Retracement Levels with $FRC
Hey traders! Are you ready to supercharge your trading game with a powerful technique used by the legendary Inner Circle Trader (ICT)? Today, we're diving into the world of Optimal Trade Entry (OTE) using Python and Fibonacci retracement levels to help you time your trades like a Wall Street pro.
Code to the article.
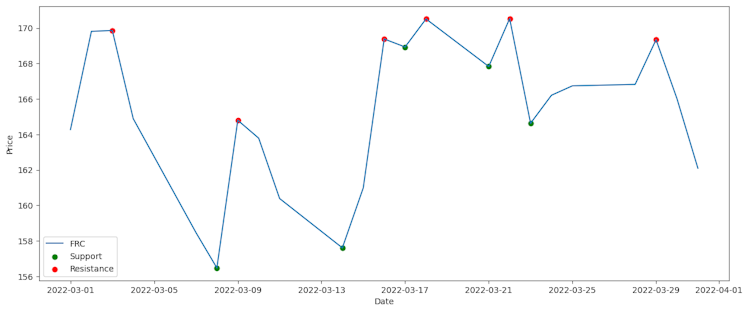
Identifying key support and resistance levels
To implement the OTE technique, we need to identify key support and resistance levels. For this example, we'll use the simple approach of finding the local minima and maxima (Rehman, 2021):
Calculating Fibonacci retracement levels
But first, let's talk about why we chose Fibonacci retracement levels for this example. These levels, derived from the famous Fibonacci sequence, are widely used by traders to identify potential support and resistance levels where the price may reverse (Chen, 2021). By combining Python and historical price data, we can calculate these levels and wait for price retracements before entering a trade.
Waiting for price retracements
In our Python example, we used the yfinance library to fetch historical data and identified key support and resistance levels by finding local minima and maxima in the price data (Jones et al., 2001; Rehman, 2021). With the most recent significant low and high points identified, we calculated the Fibonacci retracement levels (23.6%, 38.2%, 50%, 61.8%, and 76.4%) based on these points (Chen, 2021). Once the Fibonacci retracement levels were plotted on the price chart, we had a powerful visual tool to wait for price retracements before entering a trade. By monitoring these levels and executing trades when the price reaches them, you can capitalize on potential reversals and maximize your trading profits. Just remember always to use the proper risk management and set stop-loss orders to protect your trading capital (Pardo, 2019).
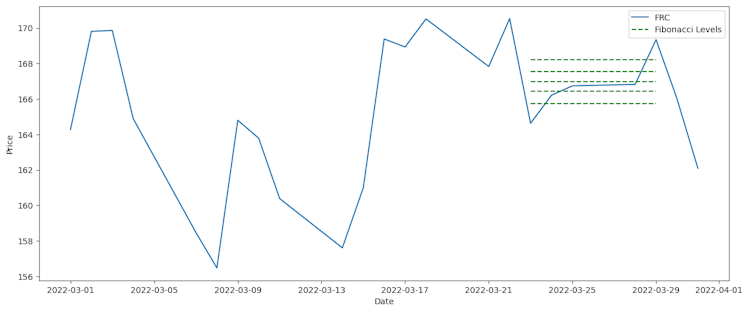
Taking it all in from the two charts, looks like $FRC isn't a buy yet on the daily time frame, even though meme communities appear to be pumping it up.
Now that you've got the knowledge to implement ICT's Optimal Trade Entry technique using Python and Fibonacci retracement levels, it's time to dominate the market like a true Wall Street pro.
So, buckle up, put this powerful trading strategy to the test, and start making your mark in the world of finance.
References
Chen, J. (2021). Fibonacci Retracement. Investopedia. Retrieved from https://www.investopedia.com/terms/f/fibonacciretracement.asp
Jones, E., Oliphant, T., & Peterson, P. (2001). SciPy: Open source scientific tools for Python. Retrieved from http://www.scipy.org/
Pardo, R. (2019). The Evaluation and Optimization of Trading Strategies. John Wiley & Sons.
Rehman, Z. U. (2021). Support and Resistance Basics. Investopedia. Retrieved from https://www.investopedia.com/articles/technical/061801.asp
Investopedia
Support and Resistance Basics
Support and resistance are used by traders to refer to price levels on charts that act as barriers to the price of an asset from getting pushed in a certain direction.
Already have an account?