Trending Assets
Top investors this month
Trending Assets
Top investors this month
First part of new post on "Active Index Reconstitution"
Interactive Brokers has a feature that allows you to create “model portfolios”. These portfolios can be traded as a basket, effectively allowing you to create your own ETF with as many stocks as you’d like, but without the hassle of needing to make hundreds of individual purchases each time you add funds. I’ve heard that other brokers will be launching similar products if they haven’t already. This is a game changer for everyone from individuals to family offices because it makes active index reconstitution (henceforth: “AIR”) easy to execute and free.
In the second part of this post I’m going to explain what AIR is, why it works, and provide a framework for anyone to use to create their own actively reconstituted index. But first…
The primary assumption that must be true in order for AIR to be worthwhile is that indexes themselves are good investments. Not all indexes are created equal, but for the most part it’s hard to go wrong investing in broad-based, market-cap weighted indexes. In the first part of my post I will do a quick run-through of what makes index investing attractive, specifically looking at:
- Performance of indexes/benchmarks vs. the active managers trying to beat them
- The impact of Fees
- The impact of Taxes
- Why market-cap weighting is important
- Psychological benefits of index investing during bear markets (this is a very important and hugely underrated piece)
Performance of indexes/benchmarks vs. the active managers trying to beat them
On this point the data is unequivocal. Before the days of Vanguard and the subsequent Cambrian explosion of index funds the only option investors had for accessing diversified portfolios was through active management. Many decades after the proliferation of index funds it has become starkly clear that active management simply doesn’t work, either on an absolute or risk-adjusted basis.
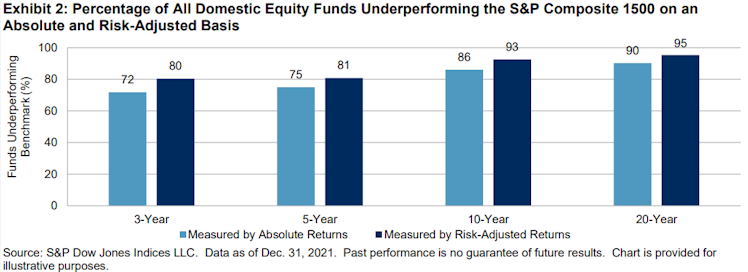
The table above shows both absolute and risk-adjusted performance. S&P runs an annual report that looks not only at performance vs. broad based indexes, but also vs. the specific benchmarks active managers are attempting to beat (for example, small-cap value). Those data are equally clear: active management is fundamentally broken. The full report can be found here.
The underperformance is consistent year in and year out. As of the 20 years leading to December 2013 the figures were still atrocious (they have been getting worse with time):
- ~90% underperformed during prior 20 years
- ~70% underperformed during prior 10 years
- ~60% underperformed during prior year
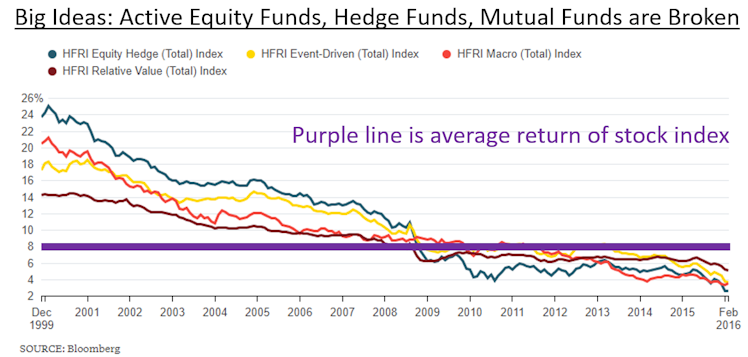
Hedge fund performance has been even worse than mutual funds. Below is a slide from a presentation I gave in 2017.

Relative performance has continued to deteriorate.
During their heyday hedge funds were expected to beat on both absolute and risk-adjusted levels. Make more money during bull markets (or any market for that matter) while losing less (or even making money) during bear markets. Today hedge funds succeed at losing less during bear markets but at a disproportionate sacrifice of earning returns at other times (meaning their risk-adjusted returns are still worse than simply diversifying with bonds). To be fair to hedge funds, 2022 is (at least through the first half of the year) a rare exception due to skyrocketing interest rates, though their outperformance has been nothing to write home about. The table below shows the returns of various hedge fund categories through the first half of 2022:
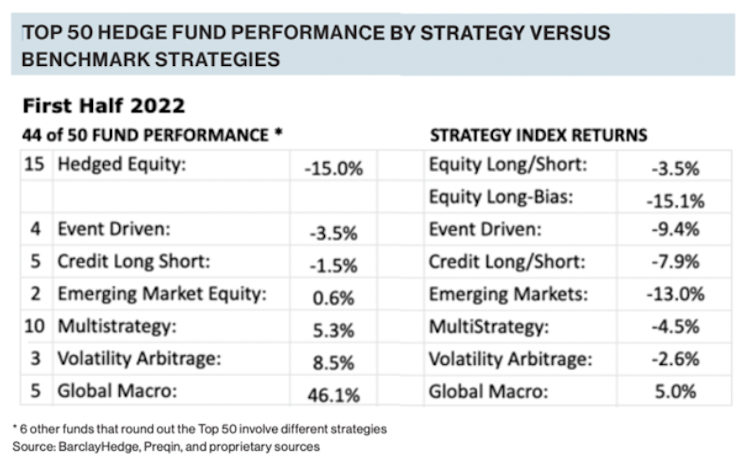
Global Macro is having a good year, but it has been among the worst long-term performers. For reference, a 60/40 blend (S&P 500 / Aggregate Bond Index) was down 10.65% over the same period while the average hedge fund declined 9.6%.
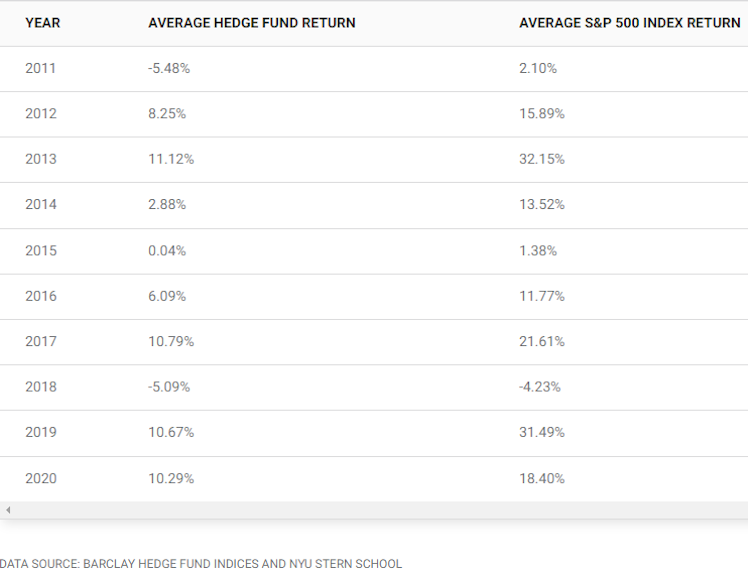
Here’s another table showing average return compared to the S&P 500 from 2011 through 2020.
Net-net, we can be virtually certain that over a 20 year period more than 90% of actively managed funds will perform worse than their benchmark on both an absolute and risk-adjusted basis. The figure is probably in the 80-90% range over a 10 year period, and in the 70-80% range over both 3 and 5 year periods. This fact is not lost on investors.
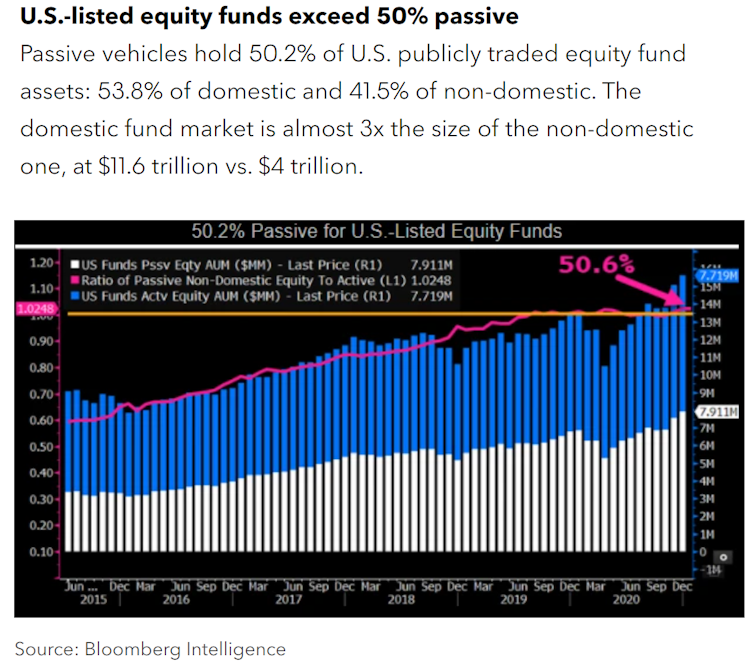
According to Bloomberg, since 2013, passive’s share of U.S. fund assets has grown about 2.3 percentage points a year.
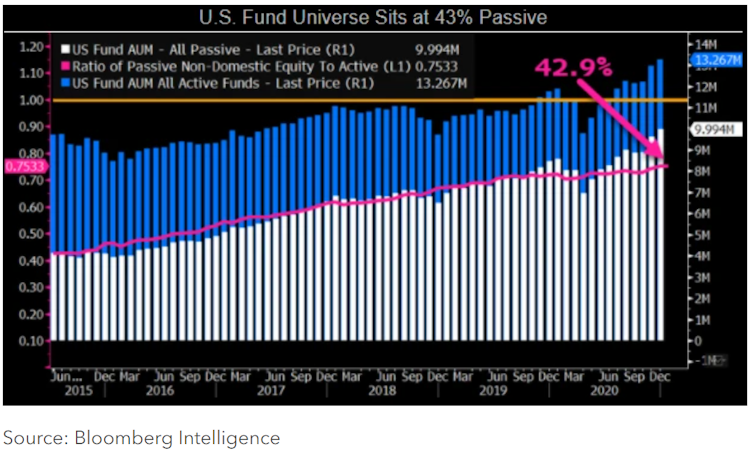
Looking strictly at equity funds passive has already passed the 50% mark.
We can conclude the following:
- By simply investing in an S&P 500 index an investor is virtually guaranteed to outperform 85%+ of active managers over a 10+ year period, and at least 70% over a period of 3 years or longer.
- The vast majority of investors who opt NOT to use index funds will be underperforming the 50%+ of investors who now do.
The impact of fees
Consider the following.
Over a specific period of time the market only has so much to offer in the way of returns. Usually the figure is between 7% and 10%. Let’s call it 8%. In order for an active manager who charges a 1% fee to tie the market’s performance they must beat it by 1% per year. But thinking about this as “only 1%” would be wrong.
If they must earn 9% to give their investors 8%, then they must beat the market by [9/8] = 1.125 (12.5%) per year. Year in, year out, ad infinitum. Beating the market by more than 12% per year for 20 years sounds a lot harder than beating it by “1%”.
As you can imagine when it comes to bonds that only have 3-4% total to offer - the impact of fees is proportionately far greater.
In practice no one invests in an active manager in order to tie the market. They want to beat the market. The odds of an S&P 500 index fund doing well over the long run are near 100% so long as humanity doesn’t engage in large-scale nuclear war or succumb to a pandemic many magnitudes more deadly than Covid.
On the other hand, as we saw above virtually all active managers are likely to underperform. When you frame it this way, in order for a person to “take the risk” of investing in an active manager (assuming they are a rational actor) they would have to expect the potential rewards to be material. Let’s put some numbers to this hypothetical.
Consider an investment of $100,000.
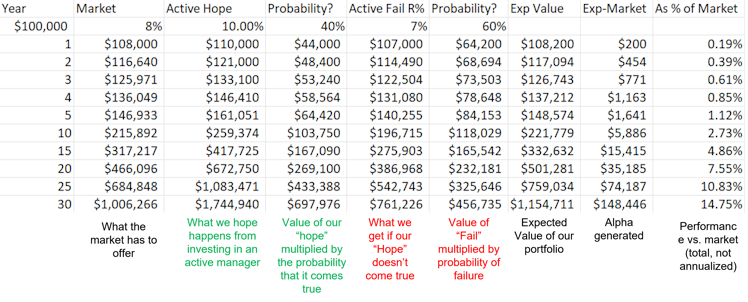
Here’s what each column means:
- “Market” column shows the growth of $100k over 30 years at an 8% return per year
- “Active Hope” column shows what would happen if we were to earn 10% per year over 30 years
- The probability column shows the expected value of the “Hope” scenario based on it’s likelihood of taking place. Note that if the probability of our “Active Hope” scenario was 100% then this column would be equal to the “Active Hope” column.
- “Active Fail” shows an alternate scenario where we earn 7% per year. Note that this figure is not a particularly bad scenario, it assumes only that the manager ties the market performance and charges a 1% fee, thereby providing a 7% return.
- The next probability column shows the expected value of our downside scenario.
- The “Exp Value” column shows the total expected value of our portfolio if we think there is a 40% chance of beating the market by 2% points (meaning 3% points per year with a 1% fee).
- “Exp-Market” shows the alpha we would expect using these assumptions
- “As % of Market” shows the TOTAL (not annualized) alpha generated over the period.
There is an obvious takeaway here. The potential alpha isn’t worth the risk. The 40%/60% split could be 30%/70%. The returns for Active Hope might be less than 10% and the downside returns could be less than 7%.
Remember, if a 10% return really means an 11% return before fees, then our active manager must have 40% odds of beating the market by an astonishing [11/8] = 1.375 = 37.5% per year, year in and year out. Does any active manager really have a 40% probability of accomplishing this? Unlikely…
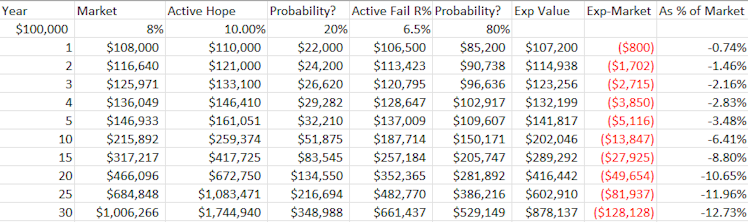
If we adjust our figures to consider a situation where the active manager has a 20% chance of getting a 10% return (net of fees) and earns 6.5% in our downside scenario instead of 7%, then we get the following:
I’ll finish off this first section with a tangent.
When Warren Buffett was first starting out he was able to identify companies that traded far below the value of bonds they held on their balance sheets. If you are able to find publicly traded companies trading at $0.40 on the $1.00 then there is plenty of room to make up for a 1% or even 2% annual management fee. But those opportunities are gone…
I made this slide for a presentation I gave 5 years ago and the points have only gotten truer since.
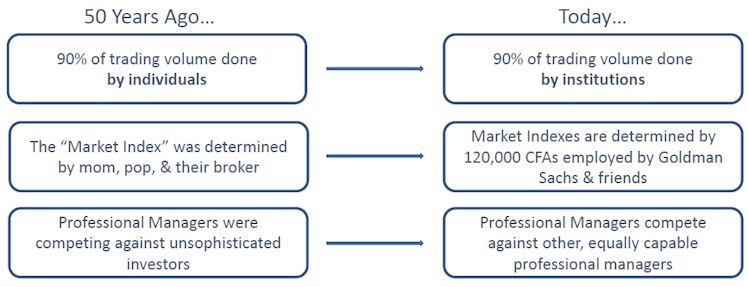
There are now more than 160,000 CFAs. There are around 7,500 mutual funds and more than 3,000 hedge funds. They collectively employ hundreds of thousands of individuals who have tools like Bloomberg terminals and Koyfin (what I use). They don’t have to travel in person and pour through thousands of pages of physical documents to access the financial reports of companies - everything is online and accessible by anyone.
This explains why my previous chart goes straight down and to the right over time:
20+ years ago there was less competition in setting asset prices…As competition increases prices get more accurate. This leaves little room to generate enough alpha to cover fees.
Koyfin
Comprehensive financial data analysis - Koyfin
Koyfin provides tools for investors to research stocks & other asset classes. Koyfin covers equities, ETFs, mutual funds, forex, bonds, etc.
Already have an account?