Trending Assets
Top investors this month
Trending Assets
Top investors this month
"Just Keep Swimming"
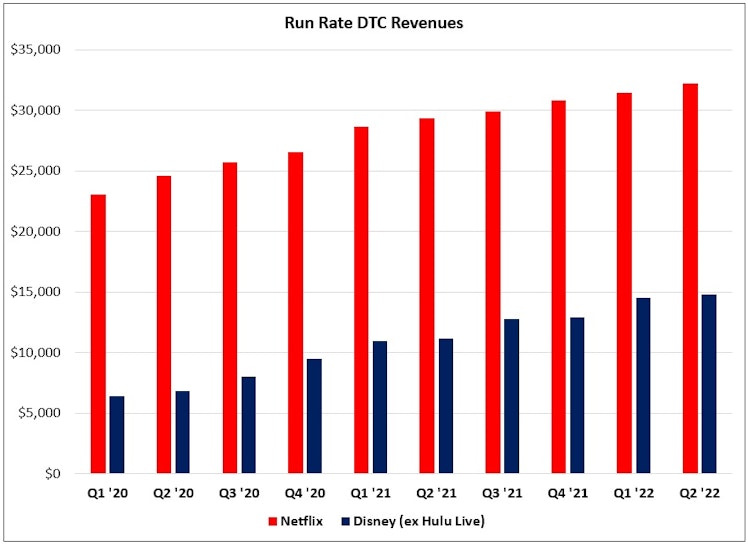
In Q2 FY22, Disney+ reached ~138 million global paid subscribers (+33% YoY); inclusive of Hulu SVOD and ESPN+, Disney’s DTC services have more than 200 million paid subs. As these numbers suggest, and the charts below show, Disney has gained a lot of ground on the industry leader, cementing its position as a top player in the global VOD business. (That said, Netflix’s run rate DTC revenues are still ~120% higher than Disney’s.)
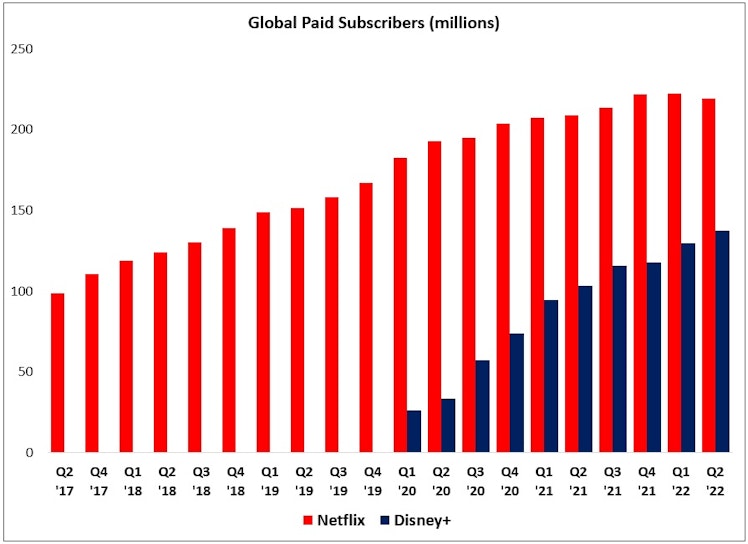
In addition, as management reiterated on the call, they believe Disney+ will have 230 million to 260 million subscribers by FY24 (implies another ~80% subscriber growth from here); that outcome, if achieved, would likely put the Disney+ global sub base on par with Netflix. (“Disney+ isn’t even five years old yet; it's still a toddler. There’s lots of growth to come on Disney+.”)
In terms of the financial profile for Disney’s DTC services, I’m encouraged by the trends that we’re seeing (and I remain fully convinced that these will be incredibly profitable and valuable businesses over the long run).
The “streaming is a bad business” drumbeat has grown louder over the past 6-12 months, but I’m of the opinion that this conclusion will prove a misguided half-truth in the fullness of time for those who achieve global scale, notably Disney and Netflix (industry reshuffling will contribute to that outcome – and amidst a period of heightened concern about the long-term economics of the business, particularly for the subscale players, I think it’s likely that this day is near). For example, consider the progression for Disney’s DTC run rate revenues and run rate programming & production costs since early FY20.
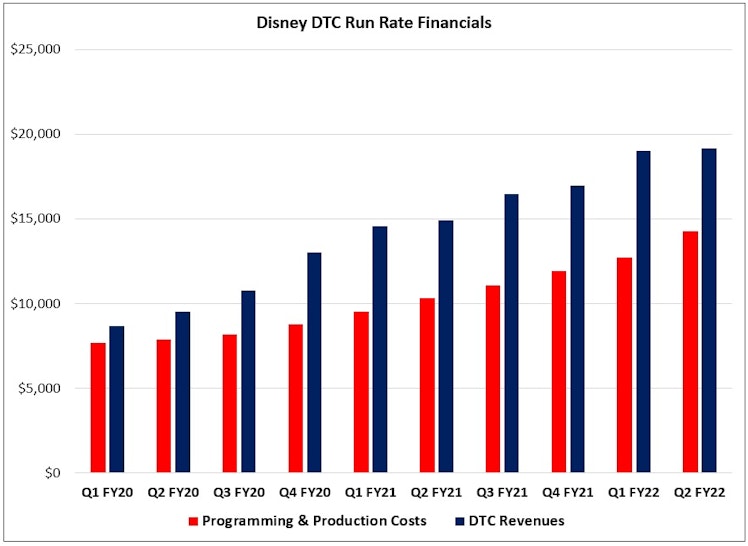
As you can see, DTC run rate revenues (including Hulu Live) increased by ~120% over the past two and a half years, from ~$8.7 billion to ~$19.2 billion. Over the same period, run rate DTC programming & production expenses increased ~85%, from ~$7.7 billion to ~$14.3 billion. The net result is that the gap between Disney’s DTC revenues and DTC content costs has increased from ~$1 billion to ~$5 billion (run rate) since Q1 FY20.
_
To read the remainder of this post, please subscribe to the TSOH Investment Research service_
thescienceofhitting.com
"Just Keep Swimming"
(Recent Disney Posts: Q1 FY22, Q4 FY21, Q3 FY21, Theatrical + IP) In Q2 FY22, Disney+ reached ~138 million global paid subscribers (+33% YoY); inclusive of Hulu SVOD and ESPN+, Disney’s DTC services have more than 200 million paid subs. As these numbers suggest, and the charts below show, Disney has gained a lot of ground on the industry leader, cementing its position as a top player in the global VOD business. (
Already have an account?