Trending Assets
Top investors this month
Trending Assets
Top investors this month
What I Learned from Trading: Respect the Trend Part 2
In Part 1, we discussed how price trend is an important consideration for us when opening a new position or adding to an existing position. We never buy a stock that's in an established downtrend and we never average down. This investing preference is heavily influenced by learning to think like a trader and adopting a trader's mindset. Traders learn to never average down and throw money at a position that is going against them. We pointed out the trade-off with this rule is we have to accept the opportunity cost of not buying a quality stock at a cheaper price. We happily bear this cost if it means we avoid the dreaded value traps. Our rules force us to wait until the price trend turns in our favour.
It’s easy to use the eye test on a price chart to see if the price is rising, falling or trading flat:
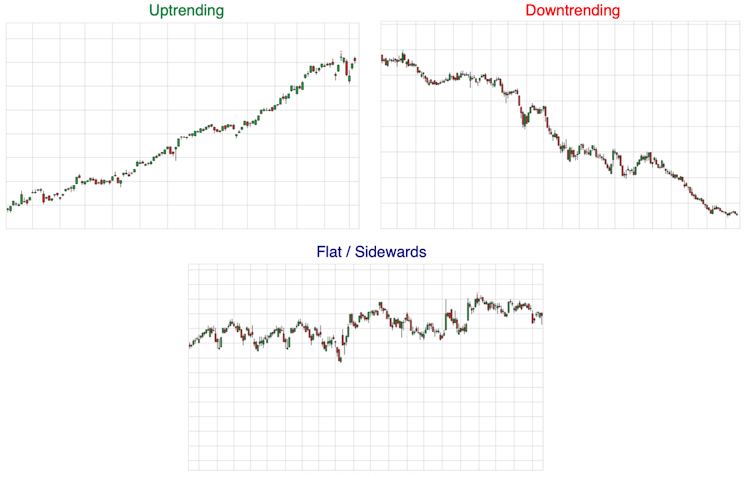
The drawback of the eye test is that it’s subjective, so any investing rules that are triggered by price trend can become fuzzy and imprecise when using the eye test. We prefer basing our investment rules on definitive quantitative metrics wherever possible. This helps removes any fuzziness in our process. When your core rules are quantitative, your long-term performance is easier to measure and assess because your process is objective, repeatable and much less subject to the inconsistencies that come with subjective, discretionary decision-making.
Our preferred quantitative trend indicator is the Simple Moving Average (SMA). The SMA is a lagging, trend-following indicator that mathematically smooths out the noise of an index or stock price. It is the average of the closing prices over a specified look-back period and is easily plotted on the same graph as the stock price.
The SMA is calculated using the following formula:
SMA Price = ∑Closing prices over the last n Periods / n
where ∑ = Summation
n = number of periods
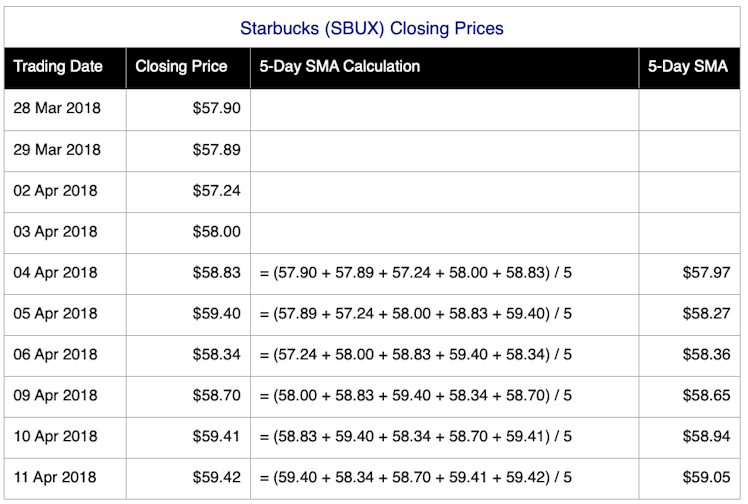
To keep the example simple, the following is a series of historical closing prices for Starbucks (SBUX) and the corresponding 5 day simple moving average (5-Day SMA) :
Institutions commonly use the 200-Day simple moving average to determine long-term trend. It’s considered a key level for all stocks and indices. Jeremy Siegel, Professor of Finance at Wharton, said this about the 200-Day SMA in his seminal book "Stocks for the Long Run":
"The most popular moving average uses prices for the past 200 trading days, and it is therefore called the 200-day moving average. It is frequently plotted in newspapers and investment letters as a key determinant of investment trends"
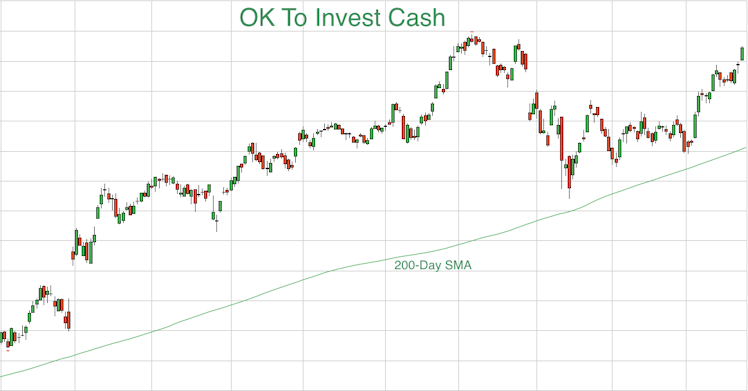
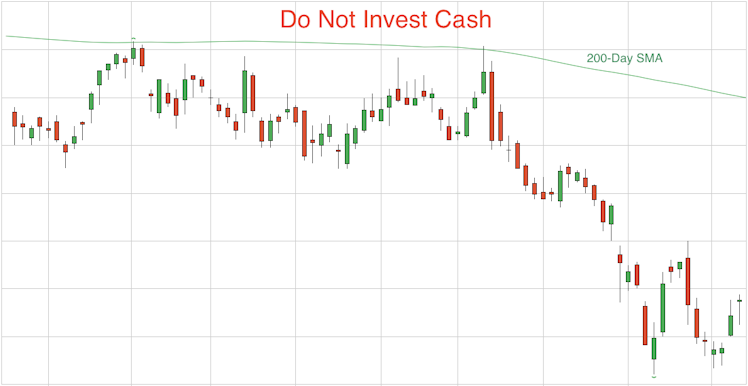
Being long-term investors, this is our preferred moving average for long-term price trend. Checking price trend is our last step when we're looking to open a new individual stock position. First of all, we identify a business we like and conduct all our fundamental business analysis and calculate our performance metrics against the financial statements. If the business passes all our due diligence, then we look a the price trend as a final step. Here is our rule for buying a pre-qualified individual stock:
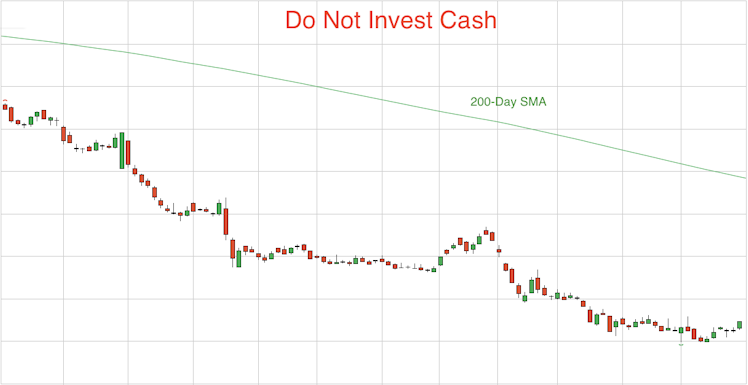
- We can invest in a pre-qualified stock when the stock price trades above a flattish to rising 200-Day SMA. If the individual stock trades below the 200-Day SMA or the 200-Day SMA is still in a downtrend, we're forced to wait until such time this rule is satisfied.
Here are some applications of this rule:
Our 200-Day SMA rule is a quantitative and objective rule that keeps us out of trouble. We're most susceptible to being shaken out of our position (or at least, we used to be) when the stock price tanks soon after buying it. If we open a new position when the stock price is in an uptrend, we increase the odds our new position will work in our favour and avoid the dreaded buyer's remorse when all your worst investor tendencies surface. Once a position is opened, the cost price of that stock will always be our lowest cost price because we can only average up, never average down.
This is NOT an optimal strategy that maximises returns and guarantees success. There's no such system and the quicker the retail investor accepts this, the better. It's a strategy that's kept us out of trouble more often than not. We've certainly been able to avoid most of the dreaded value traps over the decades.
It's important to note that this rule only applies to individual stocks. We can buy additional units in our market index funds at any time. However, we do tend to wait for evidence the downtrend in the underlying index has reversed before buying more units. We won't necessarily wait until the index trends above the 200-Day SMA, but we want to see evidence of a reversal (e.g. a higher low has been formed). This is the primary reason why we've been posting our Technical Analysis (TA) opinions on the S&P 500 index. We want people to see a journal of how we use TA to read the sentiment of the market, identify the current trend and spot possible reversal signals.
Our 200-Day SMA rule has also become our primarily entry criteria for medium to long-term stock trades. The concept is to use the long-term moving average as a signal to hop on board a long-term price trend that can follow a great businesses. Here's an example where a retail investor could have hopped on board Apple back in 2016:
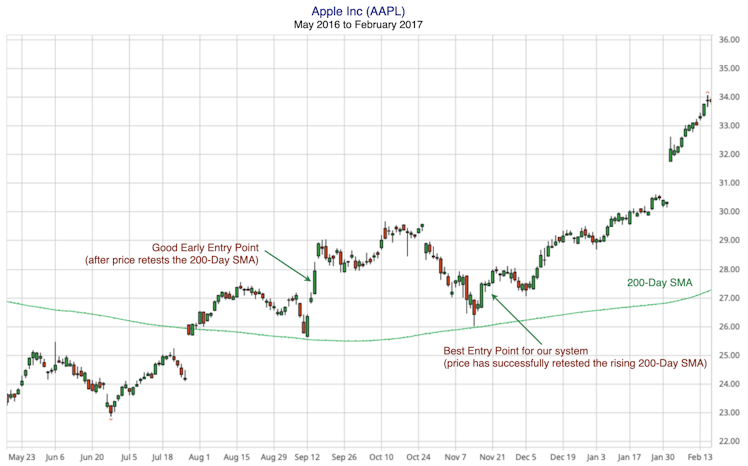
We didn't take the signal because we already own enough Apple stock, but Retail investors could have taken advantage of the weakness in Apple's share price and hopped on board a solid business with secular trends still in its favour. Of course, share price weakness always reflects concerns about the business at the time, but even back then the Apple ecosystem lumbered users with high switching costs if they owned multiple Apple devices. Those switching costs are even worse today as people rely heavily on iOS Apps for day to day living.
To sum up, we use price trend to stop us from buying individual stocks in businesses we fundamentally like, but the price is trending in the wrong direction. We use the 200-Day SMA for an objective, quantitative rule to regulate when we can buy a stock. It's also serves as a good entry point for a medium to long-term trade, allowing the trader to hop on potentially long and lucrative trends.
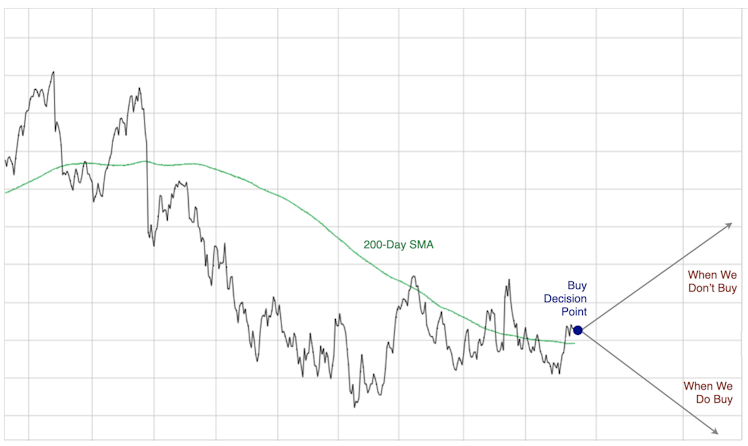
Of course, when it comes to investing and trading, this is our typical experience when facing a "buy or don't buy" decision :)
Already have an account?