Trending Assets
Top investors this month
Trending Assets
Top investors this month
Airbnb: "Growth & Profitability At Scale"
This is an extended preview of today's write-up, exclusively for Commonstock readers. To read the remainder of the post, please subscribe to the TSOH Investment Research service.
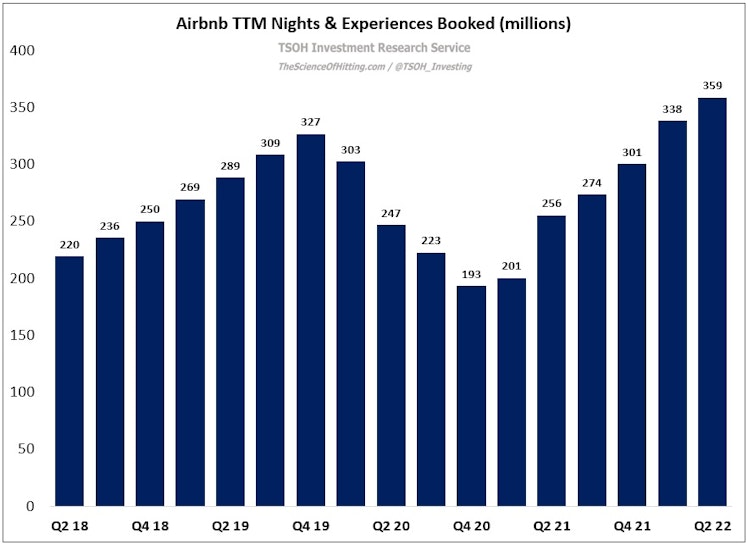
Airbnb recently reported its Q2 FY22 financial results, with the quarter providing incremental evidence that the global leader in alternative accommodations has emerged from the pandemic in a much stronger position than where it entered. Nights & Experiences (N&E) booked in Q2 were 103.7 million, the largest quarter in the company’s history (+25% YoY and +24% vs Q2 FY19). As shown below, the business has generated 359 million N&E booked over the trailing twelve months (TTM), or ~10% higher than the pre-pandemic peak. It has been a wild ride over the past two and a half years, but these results clearly indicate Airbnb is back to playing offense.
Gross booking value (GBV) in the quarter was $17.0 billion, up 27% YoY (+34% in constant currencies) and up 73% vs Q2 FY19. On the 2019 comparison, the huge discrepancy between N&E growth and GBV growth is reflective of a ~40% increase in average daily rates, or ADR’s (as shown below, Q2 FY22 ADR’s were ~$164, nearly $50 higher than in Q2 FY19).
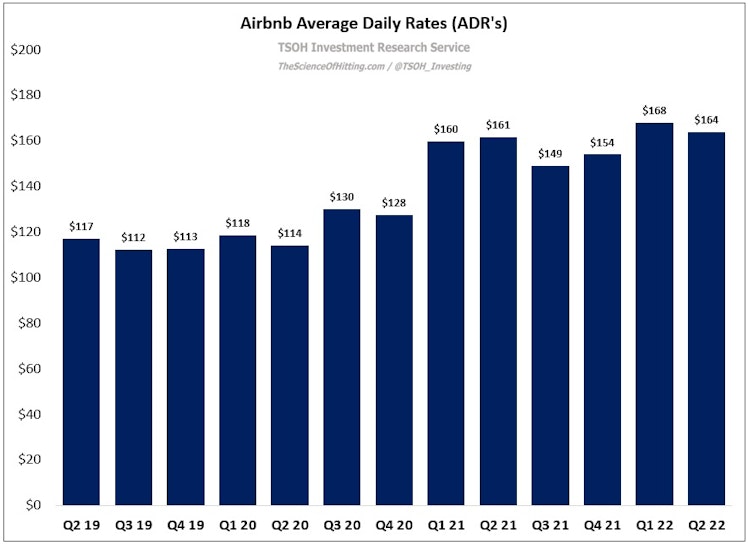
As I’ve written previously, higher ADR’s are reflective of price appreciation (hosts listing their properties at higher rates), geographic mix shift (outsized growth in North America / the U.S.), and property / accommodations mix shift (long-term stays, whole home versus a single room, etc.). On the Q2 call, management provided some color on the contribution from each of these factors: “About two-thirds of that increase (the 40% lift vs Q2 FY19) has been price appreciation, and about one-third has been mix. And so we do anticipate that over time, as more people return to travel to urban and more cross border, that ADR’s may moderate. But yes, two-thirds has been price appreciation. So it's been stickier than we anticipated six months ago.”
What remains to be seen is whether that stickiness will hold if we experience a more difficult macro environment (one where travel isn’t bucking the trend). I have no reason to believe a reversal back to ~$115 ADR’s is in the cards, but I continue to harbor some questions about the sustainability of the strength exhibited in the past six quarters. (By the way, lower ADR’s wouldn’t necessarily be a negative outcome - for example, if it was driven by geographic mix growth / a resurgence in N&E bookings growth in APAC.)
Supply & Demand
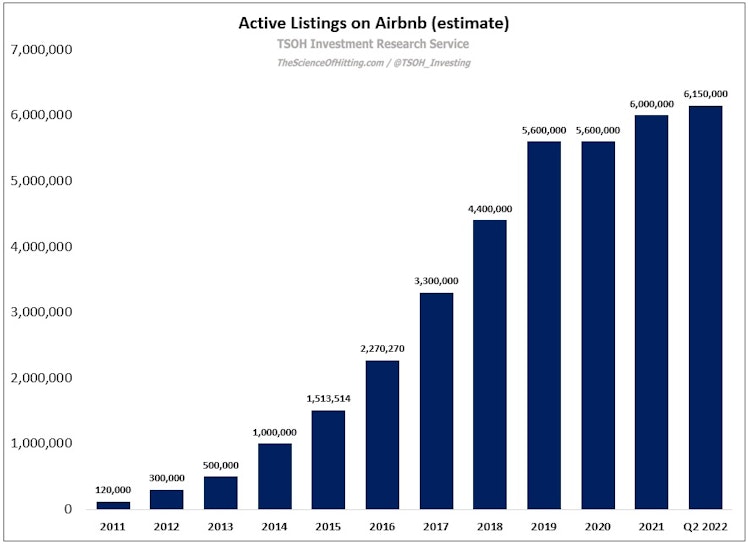
In my ABNB deep dive (Airbnb: “Belonging Anywhere”), I spoke about individual hosts and unique supply as a key point of differentiation for Airbnb’s platform (and a long-term competitive advantage for the business):
As I think about the long-term growth and sustainability of Airbnb’s business, individual host growth is one of my main KPI’s. A large and growing number of individual hosts is what truly makes the platform unique. Notably, the GBV per average listing in 2019 was ~$7,000, which suggests that this is a supplemental source of income for many of ABNB’s individual hosts. In my mind, that conclusion offers some protection to Airbnb’s unique supply (as noted earlier, ~70% of listings are only available on Airbnb). Said differently, for the average individual Airbnb host, as long as they’re seeing activity on Airbnb, it may not be worth the headache to list their homes elsewhere. If that holds, I think it will be a meaningful long-term competitive advantage for Airbnb. (“Individual hosts are the core of our host community… OTA’s are primarily focused on professional hosts.”)
Since that was published last September, Airbnb has continued to make meaningful product enhancements that highlight its unrivaled host supply; the two most notable examples are “I’m Flexible” and Airbnb Categories. As CEO Brian Chesky discussed on the Q2 call, both of these features enable Airbnb to highlight what makes it unique from competing platforms like Vrbo:
“For decades, travel search has worked the same way: there's a search box and you are asked to enter a location… Airbnb is in 100,000 locations all over the world; people can't type 100,000 destinations into a search box. And so, people miss millions of unique Airbnb’s they would have never known to search for… We think that categories can allow us to point demand to where we have supply. This, I think, is one of our really big opportunities… Our business model works uniquely for this because we have a lot of unique inventory.”
Features like Categories and “I’m Flexible” are directly translating to success for new supply (most importantly for individuals with a single listing / non-professional hosts), with management noting on the call that the majority of hosts secure a guest booking within their first week on Airbnb (“we’re distributing guest discovery across more destinations and dates”).
That said, as a frequent Airbnb user, I’ve found that some of these product changes have been detrimental to the guest user experience - and I think that outcome is directly related to the company’s goals on the other side of the equation (helping new listings see early success in order to continue expanding the number of hosts and to continue growing unique supply). One notable example is that there’s no way on Airbnb to sort listings by the quality of the listing (guest rating), the number of reviews (experienced hosts), etc. This would clearly be a useful tool for guests – but it could also be an impediment to the success of new listings / unestablished hosts, which is critical to attracting and retaining unique (new) supply. At the end of the day, I’d bet the company has concluded that this is a product design decision (trade-off) that is worth making to support its long-term business goals.
Long-Term Stays
A quick update on this topic, which I spoke about in detail last quarter. (“I think it’s an open question whether long-term stays will continue to drive the majority of ABNB’s incremental bookings growth in the years ahead, as they did from 2019 – 2021.”) This continues to be a significant source of volume for Airbnb, and a use case where their consumer value proposition / ability to differentiate from traditional travel accommodations is most apparent.
(End Of Preview)
thescienceofhitting.com
"Growth & Profitability At Scale"
Airbnb recently reported its Q2 FY22 financial results, with the quarter providing incremental evidence that the global leader in alternative accommodations has emerged from the pandemic in a much stronger position than where it entered. Nights & Experiences (N&E) booked in Q2 were 103.7 million, the largest quarter in the company’s history (+25% YoY and +24% vs Q2 FY19). As shown below, the business has generated 359 million N&E booked over the trailing twelve months (TTM),
Already have an account?