Trending Assets
Top investors this month
Trending Assets
Top investors this month
Buybacks Still Only 0.67% of S&P Market Cap
Share buybacks and dividends amounted to $1.4T over the trailing four quarters, the highest level we have seen both on the below chart, and historically. The trailing average yield on dividends is 1.27%, with a 2.18% yield on buybacks, amounting to a combined 3.45% for the S&P 500.
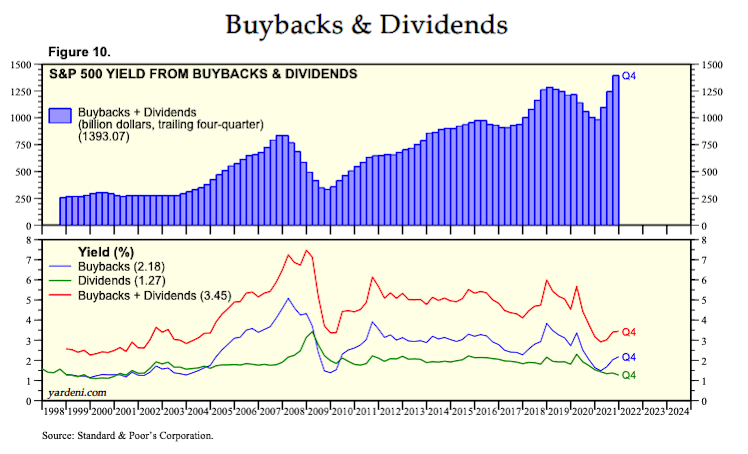
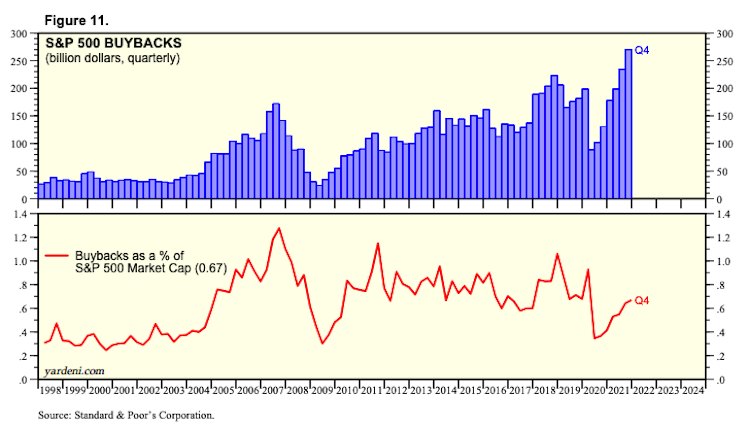
What might interest you, however, is that buybacks are still only 0.67% of the S&P 500 market cap, sitting below the average since 2005.
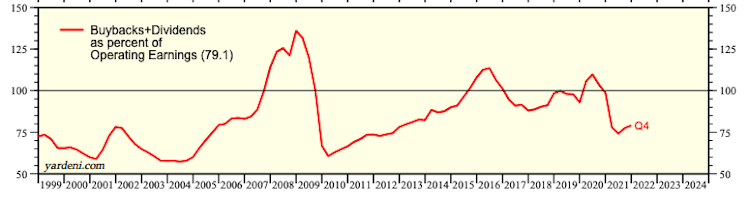
If we take buybacks & dividends as a % of operating earnings over the same time period, it's currently sitting at 79.1%, still well above the post-tech-bubble lows and the GFC period.
Going back to Q4 buybacks, it has been reported that S&P companies spend $270.1B buying back shares in this period, up from the $234.6B in Q3 and $130.6B in Q4 of 2020. For the full year 2021, buybacks hit a record $881.7B, up from $519.8B in 2020 and $806.4B in 2018.
Sam Ro, from the Tker, said the following related to this record level of buybacks, and the fact that as a % of S&P 500 market cap, it still remains pretty small:
"All that said, it’s not obvious that buybacks are distorting the stock market more so today than they might have historically. That’s because the value of the stock market has been climbing at a similar pace as buybacks.
While 0.67% is not nothing, it’s not particularly large either. The relatively small scale of buybacks in the market is echoed by their relatively small impact on earnings per share.
JPMorgan Asset Management (JPMAM) decomposed S&P 500’s earnings per share (EPS) down to its growth drivers: revenue, profit margin, and change in share count.
If buybacks were having a material impact on earnings per share, then the impact of the change in share count would be significant.
However, JPMAM’s analysis found the change in share count actually had a modest net negative impact on EPS in 2021. From 2001 to 2020, on average the change in share count was responsible for just 0.3% of the 6.0% EPS growth during that period."
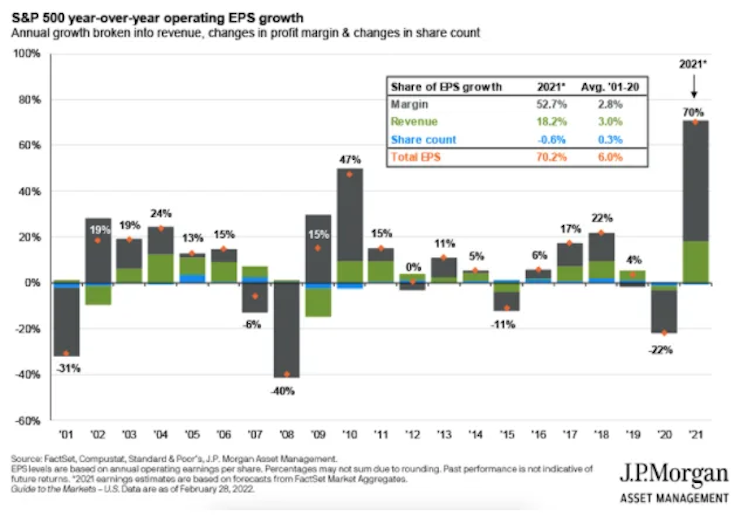
"However, it’s possible that buyback activity may have a greater impact on EPS this year with stock prices having fallen significantly".
am.jpmorgan.com
Guide to the Markets
The J.P. Morgan Guide to the Markets illustrates a comprehensive array of market and economic histories, trends and statistics through clear charts and graphs.
Already have an account?