Trending Assets
Top investors this month
Trending Assets
Top investors this month
TA Opinion: The Green Shoots of Recovery Hypothesis is still intact !
Although it was a short trading week, most would agree it was still an exciting one. We had a very strong move to the downside on Wednesday and this bled into Thursday. Today (Friday), we saw a strong counter move to the upside as the battle between the bulls and the bears rages on. This is a great time for budding technical analysts to be studying the market.
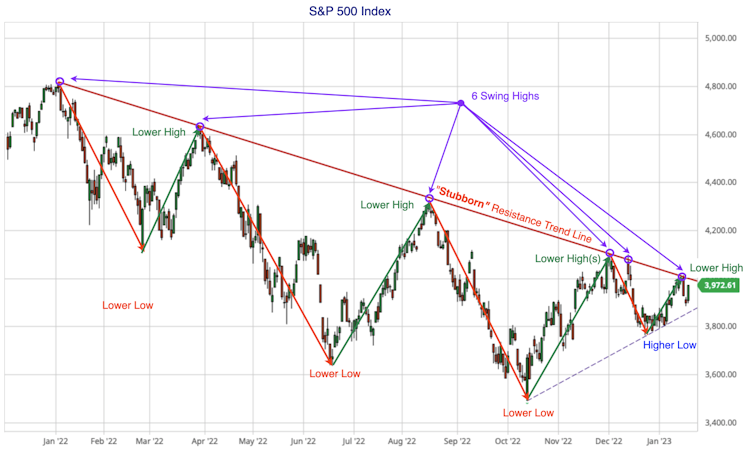
The strong downward move on Wednesday (down -1.56%) reconfirmed how stubborn this resistance trend line has become. A linear trend line takes 3 swing highs to become established and easy to identify. We've now experienced 6 swing highs, making this downward trend line a very stubborn one. A lot of participants seem to be fading the market every time we touch this line. Although it's speculation on my part, I feel that it's most likely to be the institutional traders contributing the most to the fade. this has been a good study in the self-fulfilling prophecy effect playing out. Most traders expect the market to retrace at the line of resistance and enough of them behave as such to make it happen. It's going to take real buyer enthusiasm and conviction to breach this level in a sustained manner.
The good news is we haven't taken out the higher low yet, and this keeps my hypothesis of the green shoots of recovery intact. The real battleground level is around 3,800 where the higher low was established. As long as this level is preserved and defended, the bulls haven't been defeated and still remain in the game. In fact, there's some evidence of good news from a technical perspective. Let's zoom in and look at a few features of this battle:
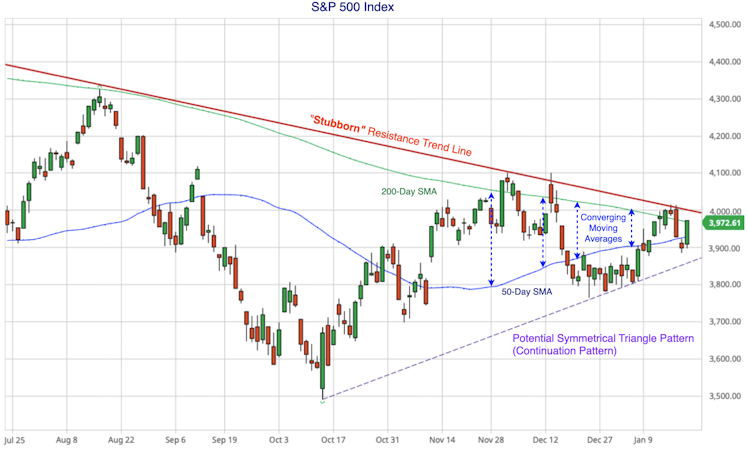
The S&P 500 index has emphatically risen above the 50-Day SMA to close slightly above the all important 200-Day SMA. Buyers have stepped in to stem the selling. We're seeing a potential symmetrical triangle being formed which is considered to be a continuation pattern. This means the long-term up trending index could be re-established. No doubt it will take plenty of time to reach market recovery, but the reversal of the downtrend could already be in play. We're also seeing convergence between a rising 50-Day SMA and the 200-Day SMA. The closing of the gap shows the shorter-term moving average has the potential to cross above the longer-term moving average in the near future. This "golden cross" is always a bullish sign. Traders using the MACD oscillator will be seeing the improvement, but as a price action trader, I was trained to rely on my eye and look at the closing gap (convergence) between the moving averages.
there's no doubt we're still in a bear market and those using On Balance Volume indicator will see a bearish bias is still very much in play. However, we're seeing some evidence the technicals starting to improve. The battle between the bulls and the bears is still being keenly waged, but the worst of the bleeding in the markets may have been stemmed. Of course, this all falls to nought if the future macro news is worse than the market collectively expects. Earnings season is going to be key here, especially when companies disclose their outlooks. Fundamentals will always run roughshod over technicals, but in the absence of unexpectedly bad news we could be at the point where the bottom is already in. This would be long awaited relief for long term investors.
The market has likely already priced in some bad news. Let's hope for a good earnings season where CEO outlooks aren't going to be worse than the market expects.
Already have an account?