Trending Assets
Top investors this month
Trending Assets
Top investors this month
$10.3MFollowers
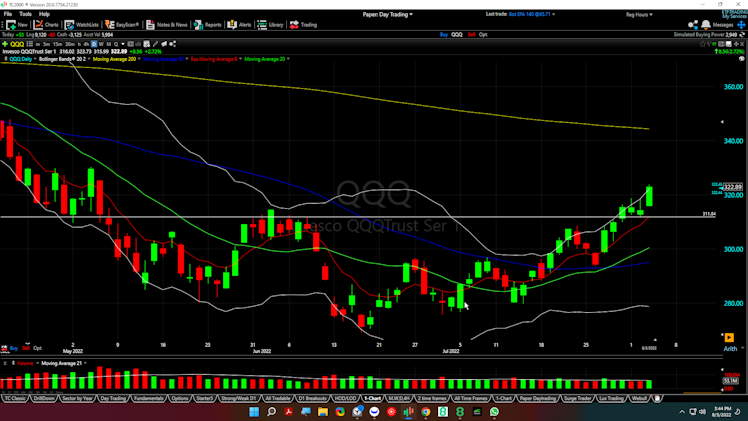
Looking good, closed above the last 2 days bearish doji candles, the next resistance level that I see is the 200 day simple moving average (yellow line) on my chart, at about 345, with the support level being 311.84, the horizontal white line. My chart is in the comments section.
Already have an account?