Trending Assets
Top investors this month
Trending Assets
Top investors this month
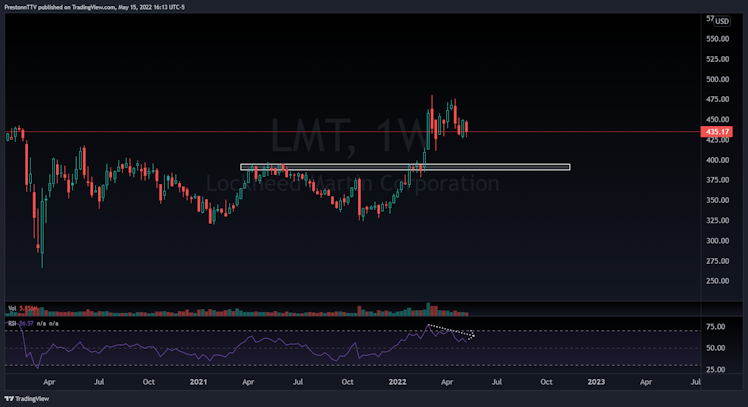
$LMT Technical Analysis Projection
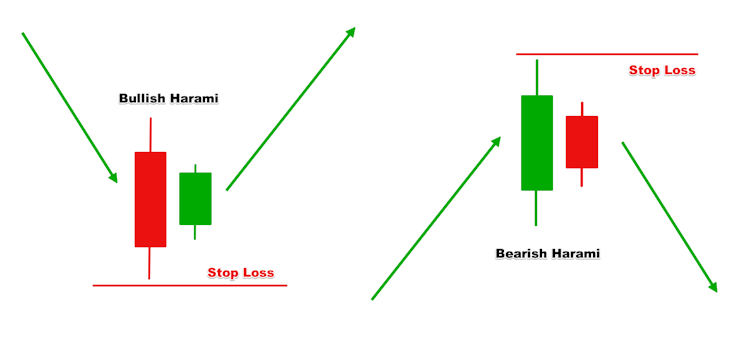
$LMT has held up really well compared to the overall market, but it is showing MAJOR warning signs now. First, we see a bearish harami candle on the weekly with bearish divergence on RSI, two bearish indicators which point to more downside.
If this downside plays out, we should get a test of the $390s area. This stock does not move quickly, so a test of the $390s could test a few months as this is on the weekly chart.
Already have an account?