Trending Assets
Top investors this month
Trending Assets
Top investors this month
$11.6MFollowers
Chart of the Day - margin of safety
Fresh off the Berkshire annual mtg, I thought it was worth thinking about the idea of margin of safety. Invented by Graham & Dodd but popularized by Buffet & Munger, the concept is simple - it is the more room you have to be wrong in your forecast
After all, we are all wrong in our forecast. Investing is about forecasting the future & forecasting is difficult. We will all make fun of the weather forecasts being wrong, but how often do we step back an analyze the accuracy, including timing, of our own
As I tell my students, if you are right 50-60% of the time, you can be a rockstar in investing. The best are not right more often, they are better risk managers, protecting how much they can lose & making multiples more when they are right
The key is finding strongly positive reward to risk ratios for each idea, & building a portfolio of these asymmetric ideas, managing risk for those that don't work while profiting from those that do
One way we can measure that margin of safety in the overall stock market is to compare the earnings yield of the overall mkt to the Fed Funds rate. This is after all the highest return on cash, as banks are finding out with deposits fleeing to lock in this yield
This topic came up on my recent Macro Matters podcast which I will post later today. There are other ways we can look at this: versus 10 yr yields or corporate bond yields, compare stock dividend to 10yr etc
However this one is pretty simple and pretty straight forward. What incentive do I as an investor have to move out of my money market account and buy stocks? Do I have a margin of safety in case I am wrong on my forecast?
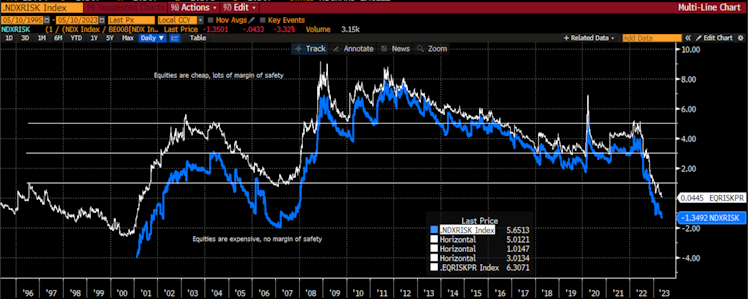
Today's chart shows this equity risk premia for the SPX in white & NDX in blue for the last 30 yrs. I would show longer for NDX but it doesn't go back before 2001
We can see the avg level of this risk premia is around 3%. I have drawn lines at 1% (getting close to expensive) & 5% (getting very cheap). We can see that by this measure, stocks were very expensive leading up to 2000 & 2007
Conversely we can see that stocks got cheap in 2002-03 & very cheap in 2009-2016. This was the period when the FOMC was incentivizing investors to take risk by making the oppty cost essentially zero
The avg of 3% equates to about 3% cash & 3% premium for 6% earnings yld which is roughly a 16x P/E. That is about where the avg has been but we don't spend a lot of time at avg
If we look at the current reading? In the SPX we have 0% equity premia i.e. the SPX earnings yield is the same as Fed Funds. For NDX it is negative meaning the earnings yield on tech is below Fed Funds
This is not asymptotic. These type of levels can persist for some time. However, when we look back thru mkt history, no one will tell you that 98-00 or 06-07 were great times to buy stocks. Those periods are marked with more regret than success
This is a time to ...
Stay Vigilant
#markets #investing #stocks #marginofsafety #stayvigilant
Already have an account?