Trending Assets
Top investors this month
Trending Assets
Top investors this month
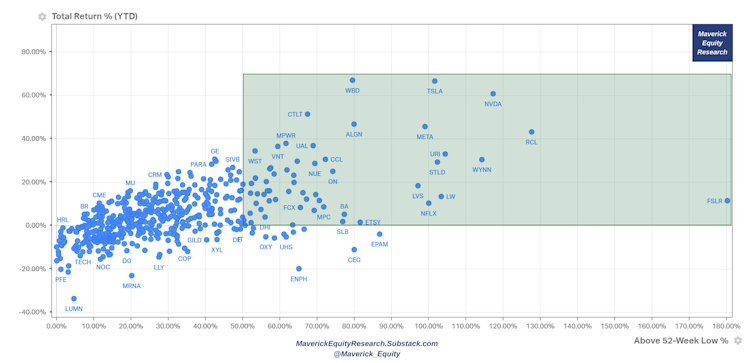
S&P 500 - 2023 Winners & Rebounders from their 52-week low
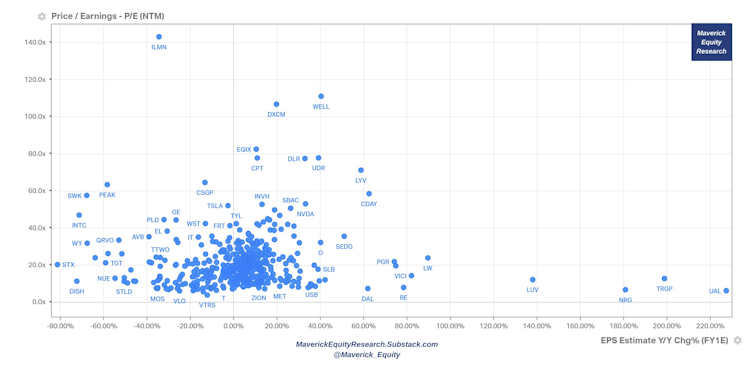
Have you ever wondered how do the S&P 500 components look on a P/E valuation basis in one shot?
There you go with the forward P/E multiple & Earnings/EPS growth (tip: check your stocks & also outliers, it can get interesting):
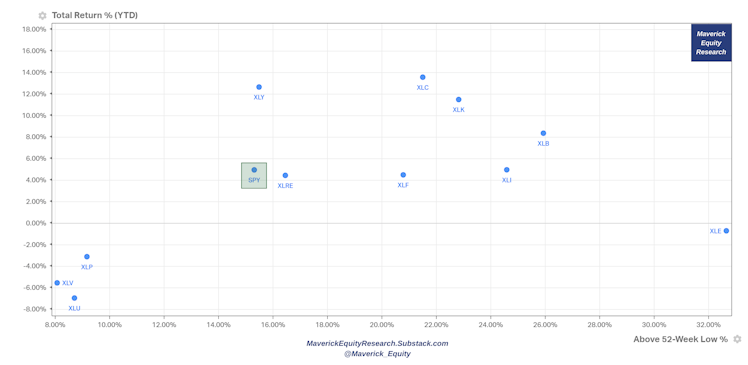
What about the S&P 500 11 Sectors? Another 'Maverick-esque' chart just came to town - Maverick S&P 500 Sectors Performance & Rotation chart:
- S&P 500 11 Sectors & S&P 500 itself $SPY: 2023 Winners & Rebounders from their 52-week low
2023 Total Return % '&' Above 52-week Low %
Thoughts?
Already have an account?