Trending Assets
Top investors this month
Trending Assets
Top investors this month
How to Calculate the Current Ratio
Today we will look at the current ratio, a liquidity ratio helping us determine companies able to pay short-term obligations.
The formula for the current ratio equals:
Current Ratio = Current Assets ÷ Current Liabilities
We can find each part of the ratio in the balance sheet.
Current Assets typically contains:
💰Cash & Equivalents
📊Short-term investments
🧾Accounts receivable
⌚Inventory
📈Prepaid expenses
Current Liabities typically contains:
💳Accounts payable
💰Short-term debt
📤Accrued expenses
💵Deferred revenue
🔑Lease obligations
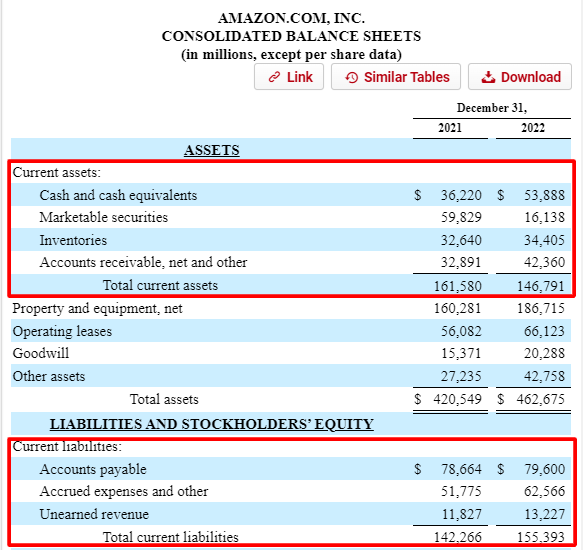
Let's use $AMZN's balance sheet from above to calculate the current ratio, everything listed in $ millions
- Current assets = 161,580
- Current liabilities = 142,266
Current ratio = 161,580 ÷ 142,266 = 1.14
Simple, huh?
A ratio under 1.00 indicates that the company’s debts due in a year or less are greater than its assets—cash or other short-term assets expected to be converted to cash within a year or less. A company with a current ratio < 1 may seem bad, it may have extenuating reasons. Depending on when a company reports, the normal cycle for the company’s collections and payment processes may lead to a high current ratio as they receive payments, but a low current ratio as those collections wane.
Also some larger retailers such as $WMT/$AMZN, can negotiate much longer-than-average payment terms with their suppliers. Large retailers can also minimize their inventory volume through an efficient supply chain. Making their current assets shrink against current liabilities, resulting in a lower current ratio. For example:
$WMT - 0.86
$AMZN - 0.94
$COST - 1.03
$SBUX - 0.75
$DE - 2.18
In theory, the higher the current ratio, the more capable a company is of paying its obligations because it has a larger proportion of short-term asset value relative to the value of its short-term liabilities. The current ratio can be useful for a company’s short-term solvency when placed in the context of what has been normal for the company and its peer group. It also offers more insight when calculated over several periods.
Already have an account?