Trending Assets
Top investors this month
Trending Assets
Top investors this month
KLA Corporation Q2’FY23 – Time for a slowdown
We just released in our newsletter the Earnings review of $KLAC which is reproduced here for our almost 1,600 Commonstock followers!
----------------------------------------------------------------------------------------------------------------------------------------------------------------
$KLAC KLA Corporation Inc., reported its fiscal Q2’FY23 (ending on 31 Dec 2022) results on 26 January 2023 and despite beating or meeting analysts’ consensus and guidance, its price headed lower by over 6.5% due the dim outlook provided.
KEY RESULTS
- Revenue of $2.98B during Q2’23 (up 27% compared to Q2’22) beating estimates by $156M and exceeding guidance provided ($2.65B to $2.95B). Revenue in the Calendar Year (“CY”) 2022 was $10.5B, up by 28%.
- Gross Margin (Non-GAAP) of 61% in Q2’23, 1.5% lower than mid-point guidance.
- Non-GAAP Operating margin of 42.4% in Q2’23, 1.0% lower than Q2’22.
- GAAP EPS for Q2’23 of $6.89 (up 46% compared to Q2’22) beating estimates by $0.24 and $0.25 higher than mid-point guidance.
- Non-GAAP EPS for Q2’23 of $7.38 (up 32% compared to Q2’22) beating estimates by $0.28 and $0.38 higher than mid-point guidance.
REVENUE & PROFITABILITY
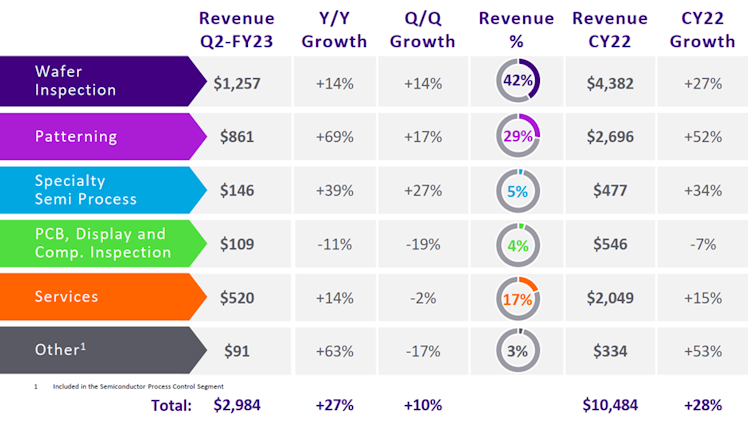
Source: KLA Q2’23 Earnings presentations
- Wafer Inspection year on year (“y/y”) growth of 14% was a result of KLA strength in advanced Optical Patterned Inspection, one of the largest and highest growth segments of WFE (>$1B annual revenue).
- Patterning was also strong (y/y growth of 69%) due to reticle inspection that has a critical role in quality control during manufacturing of both DUV and EUV.
- PCB, Display and Component Inspection were down by 11% y/y due to weakness in consumer electronic markets.
- Services remain strong with a y/y growth of 14% in Q2’23, despite headwinds in US dollar and export restrictions, demonstrating revenue durability.
- Gross margin was lower than guidance by 1.5% mainly due to the increase in non-cash inventory reserves as factory output expectations were adjusted based on current outlook (impact of 2%). When growth resumes such reserves could be released.
- Operating income was effectively impacted by gross income.
- Remaining performance obligations which provide an insight into future revenues, declined from $13.65B in prior quarter to $12.54B in the current quarter, mainly due to adjustments relating to China export restrictions, yet management expects its China sales to decline less than WFE in general.
CASHFLOW AND CAPITAL RETURNS
- Cash flow from operations of $688.3M for Q2’23 down by 15% compared to Q2’22 ($810.8M).
- Free Cash flow (“FCF”) of $594.6M for Q2’23 down by 20% compared to Q2’22 ($745.9M).
- Free cash flow margin of 19.9% for Q2’23 Vs 31.7% for Q2’22. Among others, FCF margin was impacted by lower profitability margins and higher increase in receivables compared to sales. In CY 2022 FCF margin declined to 28.5% compared to 31.1% in 2021.
- During CY 2022, $5.17B (or c.8.5% of market cap) were returned to shareholders through dividends of $689M and buybacks of $4,483M representing 173% of free cash flows. Outspending free cash flows is not optimal but this was affected by the agreed accelerated share repurchase programs ($3B out of the $6B authorized in Q4’22 – June ’22) with the final settlement executed in this quarter at an average price of $333.88.
- Remaining amount available for repurchases as of 31 December 2022 is $2.77B.
- Total cash and short term investments as of 31 December 2022 are $2.9B compared to a debt of $6.1B. There was no change in credit ratings (upper medium grade) compared to prior quarter and there is no debt payment due in CY23.
CURRENT ENVIRONMENT
- Headwinds in the semiconductor industry such as inflation, interest rates, supply chain and PC & consumer markets remaining weak, impacting both memory device manufacturers (to a higher extent) and foundry/logic customers. Nevertheless, manufacturers continue to prioritize R&D investments in the next generation technologies so as to remain competitive over the long term.
Manufacturers
- $TSM is expected to spend $34B (mid-point) in 2023 compared to $36.3B CAPEX in 2022, of which 70% will be allocated to advanced process technologies.
- $INTC not explicitly guided for 2023 CAPEX but its committed CAPEX obligations for 2023 amount to $22.7B compared to $24.8B in 2022.
- On the contrary, $MU, a memory device manufacturer, guided for accelerated slowdown in CAPEX, i.e. CAPEX of $7B-$7.5B in fiscal 2023 compared to $12.1B in fiscal 2022.
Competitors
- Lam Research expects a decline of c. 20% in WFE spending, mainly driven by memory. It also expects a headwind of $2B-$2.5B due to China export restrictions (or 12% of its total sales in CY2022). KLAC’s China export impact is relatively less than $LRCX with $500M to $700M, accounting for 6.7% of its total sales.
- The only exception to the rule is ASML which expects a 25% increase in revenue for 2023 affected by its strong backlog and the assessment made by its customers that recession will take less than lead times, thus they are not cutting back on strategic investments.
OUTLOOK
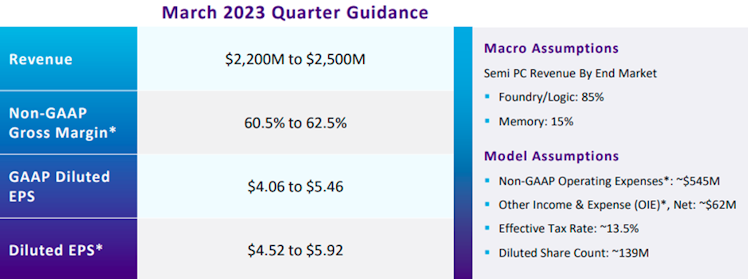
Source: KLA’s Q2’23 Earnings presentations
Management is guiding for a slowdown. Q3’22 revenue exceeded Q3’21 by 27% whereas the y/y growth for Q3’23 is estimated at 2.7%, while at the same time Non-GAAP gross margin is expected to contract by 140bps.
For the Calendar 2023, management expects gross margin to exceed 60%, effectively implying that it could be lower than 2022 and 2021 of 62.4% and 62.8%, respectively.
In terms of industry expectations, Bren Higgins, CFO stated the following:
“Looking ahead to calendar 2023, we expect industry spending to slow with the continued expectation for CY 2023 WFE demand to be down approximately 20% in the year, down from approximately $94 billion to $95 billion in CY 2022, due to increasing global macroeconomic concerns highlighted by our customers in most end markets and widely reported customer CapEx expectations.”
A key reason of the slowdown in revenues and WFE expectations is the accelerated decline in memory market and more explicitly DRAM. Despite this, KLA’s leadership in critical markets such as wafer and reticle inspection are expected to be resilient allowing KLA to perform better than the WFE market.
Long term wise, management expressed that secular growth factors (5G, AI, IoT, Automotive etc.) stated in its Investor Day are still expected to drive long term demand. Through maintaining a high level of R&D (over 55% of its operating expenses), KLA management expects to achieve market share gains while supporting the technology roadmaps of its customers.
CONCLUDING REMARKS
We believe that it was a fair quarter despite the reductions in profitability and free cash flow margins. The near term outlook is unfavorable due to the expected slowdown in economy and China export restrictions, however, it seems that KLA is better positioned than LRCX as the impact from China restrictions is less.
Over the long term, the secular growth factors and KLA’s commitment to innovate (through its R&D investments) will allow it to gain share and achieve its long term plan of 9%-11% CAGR over the next 5 years.
----------------------------------------------------------------------------------------------------------------------------------------------------------------
Disclaimer: The content of our newsletter is not a trading or investment advice and we do not provide any personal investment advice tailored to the needs of any recipient. The information provided should not be considered as a specific advice on the merits of any investment decision.
stockopine.substack.com
KLA Corporation Q2’FY23 – Time for a slowdown
KLA Corporation Inc., reported its fiscal Q2’FY23 results on 26 January 2023 and despite beating or meeting analysts’ consensus and guidance, its price headed lower by over 6.5% due the dim outlook provided.
Already have an account?