Trending Assets
Top investors this month
Trending Assets
Top investors this month
$11.6MFollowers
Chart of the Day - confluence of events
This week I am spending more time looking through the non-equity markets even though we are in the midst of earnings. I will get to earnings as well but since I am not in the weeds on the single ideas, I want to wait and assess the bigger picture later
To judge from a distance, you would think the commodity markets are in freefall this year. I see a lot of discussion about the negative oil move in spite of the OPEC+ production cuts. I hear about the bad read through from weaker copper prices
However, a glance at yearly performance shows oil is down less than 4% and copper is actually up 2% this year. Nat Gas has been in freefall down 50% and that is worth noting but may be more impacted by weather than economic slowdowns
Within the metals, nickel is having a rough go of it this year and gold is having a good year, certainly on a relative basis. The copper to gold ratio does suggest some slower growth and lower yields ahead for sure
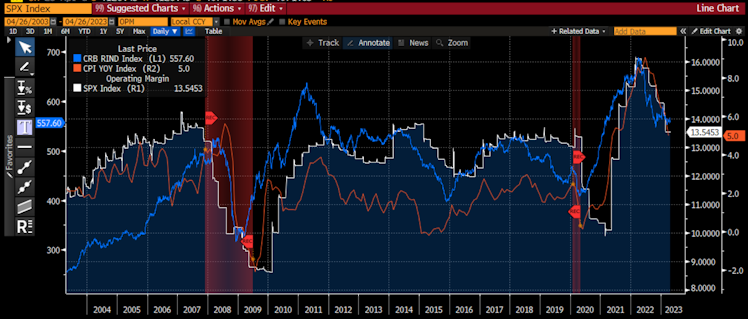
For my money, the better measure of commodities to consider is the CRB Raw Industrials Index. This is an index of non-tradable commodities. Thus, we get a look at the end-user supply/demand of products that do not have the extra element of CTA/trend-following/leveraged money trading too
I have shown in the past the fit of commodity prices and CPI. Many discuss how falling commodity prices will lower CPI rightfully so. This is true whether looking at the tradable or non-tradable CRB Index
However, today I also add to this chart the S&P 500 operating margins. You can see this measure in white also tracks the CRB Raw Indus pretty closely. This is probably less intuitive as higher raw materials cost and wage inflation were though to hurt margins
For every tech name that got hurt on that front, there were cyclicals - energy, materials, industrials - that were helped by finally getting some pricing. Even consumer staples names took advantage and ratcheted up price using higher commodities as an excuse.
This looks to be normalizing now. Operating margins that hit 16% are now 13.5% and look to be on the move back to the 12-12.5% range. Not a collapse, just a normalizing. Just another drag on earnings going forward. One needs a lot of top-line to compensate
If we look closely we can see that the CRB Raw Industrials leads both CPI and operating margins by a little bit. If I look at it on its own, China GDP growth is a bigger driver than US GDP growth. We saw before China is picking up a bit but not back to where it was
For now, we should keep a close eye on CRB. In 2015 and 2019 the move was more like 25% vs. 20% now. In 2008 it was 40%. It will give us an idea of where these margins might find a home
Stay Vigilant
#markets #investing #stocks #commodities #margins #stayvigilant
Already have an account?