Trending Assets
Top investors this month
Trending Assets
Top investors this month
Food for thought
On today’s post:
- Weird week
- FED put is still there
- Don’t be a hero
- Better Buy Oil
- Place your bets
- Portfolio (PRO Content)
- What Am I Doing? (PRO Content)
- Rates in Brazil and the $BRL (PRO Content)
- Stone ($STNE) (PRO Content)
### Weird Week
Monday wasn’t a typical day. Write this down. It was the 6th time that Nasdaq reversed a +4% intraday drop to a close high (since 1990). On all occasions, the forward return for the next three months was negative.
Liquidity remained low while options trading exploded. On Monday, we saw the most significant amount of options traded EVER, with the highest put notional minus call notional EVER.
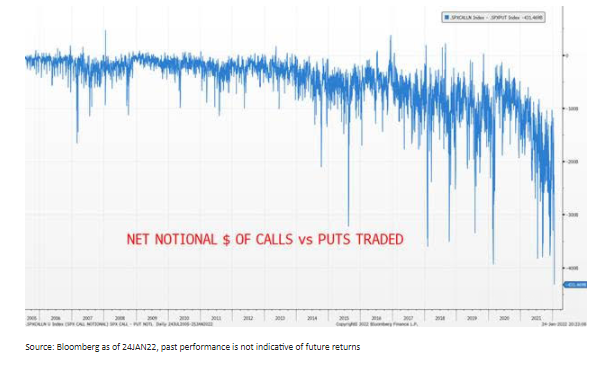
Source: GS.
The feeling is that someone (probably retail investors) discovered put options. Bonanza time is gone. The FED has transitioned from an easing campaign to a tightening one, meaning that the market will be setting new levels.
### FED put is still there
The first tool the FED implement when looking for tightening or easing conditions is communication. The forward guidance helps the market to adjust to coming actions and gives the FED an answer if the guided steps are appropriate or not.
The market has been telling the FED that actions guided were insufficient, and communication should get more challenging. And, on Wednesday, they delivered just that.
FED suggested that near-term risk increased, and prices should adjust to that given the uncertain path ahead, indicating consecutive hikes ahead.
Chair Powell clarified that FED’s job isn’t to set a floor to stock prices — the so-called FED Put. The problem is that, historically, FED’s decisions are — indeed— influenced by stock prices and volatility.
### Don’t be a hero
As on last week's post, when the S&P 500 lost the 200ma, volatility (fear) increased sharply. With the VIX above 25, fundamentals lose importance, and market participants are more price action-driven, playing macro thematic instead of specific fundamentals.
However, history plays with the bulls unless we see an economic recession. Most people cannot understand that you can only participate in a bull market if you survive the bear.
Perhaps, this isn’t a good year for leverage or to hold companies with a poor unproven operational track record. But, the less you lose today, the more you will make in the future.
Historically, companies with unmistakable competitive edges, the ability to adapt, considerable opportunities to reinvest their cash flow, and less affected by the macro thematic are enormous opportunities for those looking to compound interest on capital ($MELI).
### Better Buy Oil
A new report from Morgan Stanley evaluated O&G companies respective to their historical valuation. It’s worth mentioning that, according to their estimates, the sector is pricing WTI at $62/bbl, well below the forward curve at $80/bbl.
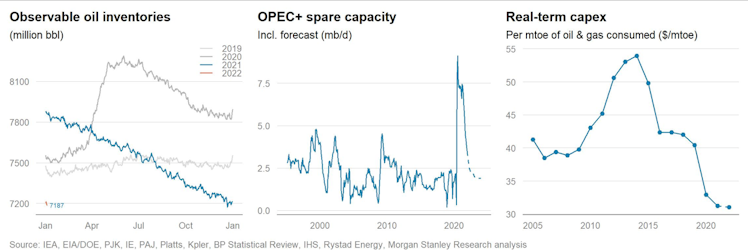
Source: Morgan Stanley.
I think that looking for an exit price for the Oil trade is premature. I don’t believe that Oil Companies will outperform the S&P 500 in the next decade, but every commodity cycle comes with an overshoot in prices. We haven’t seen that in Oil yet.
However, the best way to leverage a commodity cycle is through equity. Unlike the physical asset, a company has operational leverage, offering excellent returns if the rotation trade is right ($PBR).
### Place your bets
There was an incredible flow from investors migrating from defensive and cyclical stocks to secular growth in the past decade.
However, since investors became more skeptical about the tightening cycle and the FED suggested they were serious about fighting inflation, investors dumped secular growth stocks and moved to Value stocks.
Higher inflation and resilient growth work well for Oil, but investors will be looking to play the defense game if the latter starts fading away.
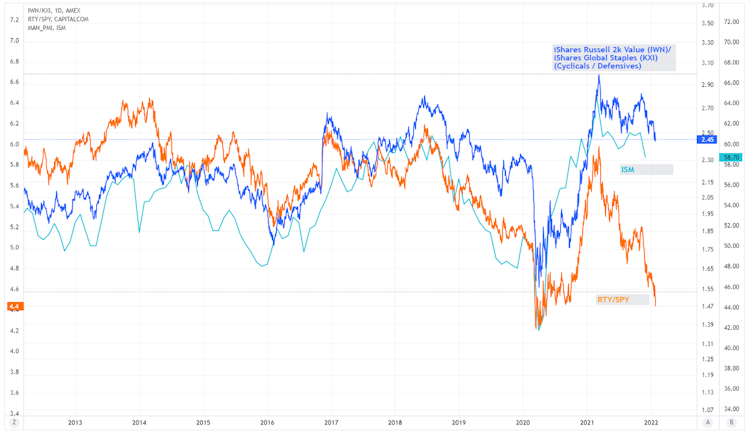
Source: Tradingview.
With that in mind, the chart above is interesting. Historically, ISM is an excellent leading indicator for equity returns, especially for value companies. This trade works amazingly well in a sell-off scenario. Keep that in mind.
giro.substack.com
Petrobras ($PBR)
Update on the new strategic plan
Already have an account?