Trending Assets
Top investors this month
Trending Assets
Top investors this month
$11.6MFollowers
Chart of the Day - reward to risk
I knew I would have this week off so I planned all along to do my outdoor Christmas lights this week. Most of my neighbors chose to do them 2-3 wks ago when we had unseasonably warm weather in the 70s. I chose to play golf in the nice weather knowing I had this week off. I took a risk because there was a chance it could be quite cold this week & I would hanging lights & garland with frozen fingers. However, there was also a chance it would be mild & I would win both ways, getting to enjoy the nice weather on the golf course & not being punished as I hung my lights. Thankfully it is in the 50s this week.
It is this reward to risk mindset that permeates just about everything I do. When my colleague MV & I were interviewing candidates for our Investment Management Academy, the question that came up the most to us was how do you know when it is the right time to buy a stock. Our answer was, you don't. How can you? What you can do, besides rigorous fundamental work, is try to stock the odds on your side. You try to assess the reward to risk for each investment. You choose the investments with the best reward to risk ratio. If you stay disciplined, & even are right 50-55% of the time, this works in your favor.
In the mkts we forecast for a living. Forecasting is bound to be wrong most times. That is why we try to do extensive scenario analysis to assess what happens when we are wrong. Being wrong in this context can mean both being too optimistic & seeing worse outcomes, as well as being too pessimistic & seeing better outcomes.
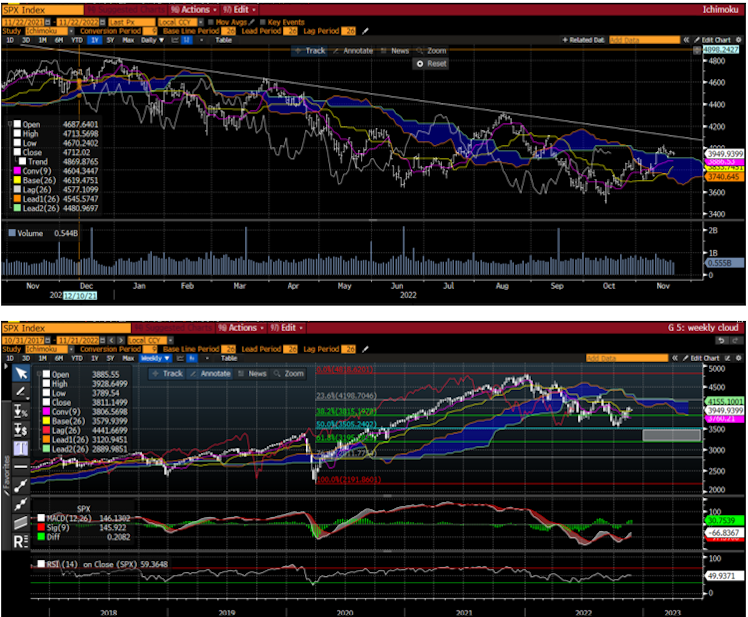
A lot also depends on your time horizon. Let's use simple technical analysis to show this. The top chart is a daily chart of SPX. One can see that there is a declining trend to price over the course of a year. You did not need this chart to know that. The chart does show there is some cadence to this decline. I recall saying many times this year we would see a waterfall decline. Short-term we can also see some support in the blue cloud zone around 3900. However, we run into resistance at 4100. With a mkt at 3950 that means our reward to risk is 4100-3950 = 150 vs. 3950-3900 = 50. 150/50 or 3 to 1. Assuming we stop ourselves out on a close below 3900.
In the weekly chart at the bottom we see the same downtrend. It is more congested. The target on the weekly chart is much lower, at the bottom of the filled rectangle at 3200. The upside resistance is a little higher on the long term chart at 4200. So if you are a longer term bear, you sell at 3950 and risk 250 to make 750 or 3 to 1 reward to risk.
Two different time horizons, two different positions, both with a 3 to 1 reward to risk ratio. You have to ask yourself which one you most align with.
Of course there is a lot more that may need to go into your analysis an decision of which horizon makes the most sense. I try to help at stayvigilant.substack.com.
Most importantly ... Stay Vigilant
#markets #investing #stocks #rewardtorisk
Already have an account?