Trending Assets
Top investors this month
Trending Assets
Top investors this month
$11.6MFollowers
Chart of the Day - tradable top?
I do not like to post any 'trade ideas'. I am not a fincl advisor. I have no idea what everyone's portfolios or situations looks like. This is also not financial advice. DYOR etc.
However, I do like to point out the things that I am focusing on & ask questions that I think people need to be asking. We may come to different conclusions which is fine. However, I hope I can help by asking questions I know professionals are asking
I pull those questions together into my weekly Substack where I try to make it a more cohesive thought piece. One of the ideas from my behavioral section of the Substack, also in my Excell with Options this week, was the potential for a tradable top in the NDX
The NDX has been where all of the money has been made this year. NDX names have been generating all of the buzz. NDX has become synonymous with AI. As I heard on Jim Grant's podcast, AI has become synonymous with fire 2.0
However, the beauty of technical analysis is that it doesn't listen to podcasts or media or other investors. It observes price action & allows one to see what the supply & demand picture look like. Using past parameters we can determine when there is excess fear or greed. It is a visual form of a behavioral guide
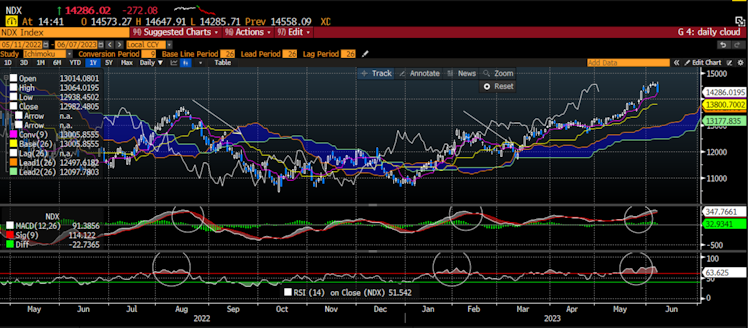
Looking at the ichimoku chart today, you can see the strength of the rally on top. However, you can see in the bottom panel the extreme relative strength as well. I have highlighted with circles when it has gotten this extreme before
As I said in my Substack, this wouldn't be fadable until the MACD in the middle crossed lower. I have circle those areas. You can see on the right my circle from several days ago. We are crossing lower
Finally I drew arrows of the moves we have seen lower when both the RSI was extreme & the MACD is crossing over. It appears to me we are there now
This isn't just a technical call though. Back to fear & greed, the CNN Fear & Greed Index registered an extreme greed reading yesterday. Last time we saw that was 2020 I think
Then we saw the blow-off tops in many NDX single names over the past few days that are unprofitable. The leaders have also been lagging
I also suggested the FOMC may need to stay higher 4 longer. Cuts have been priced out. The 6 mth fwd Fed Funds is back to 5.25% after having dropped to 4.5%. The last time we were here the NDX fwd P/E was 19.5X vs. the current 23.5X
The rally since the October lows has been entirely driven by P/E. Multiples are a form of sentiment. Earnings or even forward earnings have not driven the rally. It was the expectation, the multiple, that has. This is more fragile than the 'fundamentals'
There are several reasons that investors should be cautious in the near term. You can see in the last year when this has happened before, we got a deeper sell off last summer but a more mild one this year. If anything I would guess this is more mild but even that could be 8%
DYOR and Stay Vigilant
#markets #investing #stocks #stayvigilant
Already have an account?