Trending Assets
Top investors this month
Trending Assets
Top investors this month
KKR Mid-Year Report, 3 Interesting Graphs
Last Month KKR published their Mid-Year Update, "Walk, Don't Run." While the 56-page long report details quite a lot and I would recommend everyone give it a read I want to highlight the 3 most interesting graphs from the report.
1.) Not a Normal Market
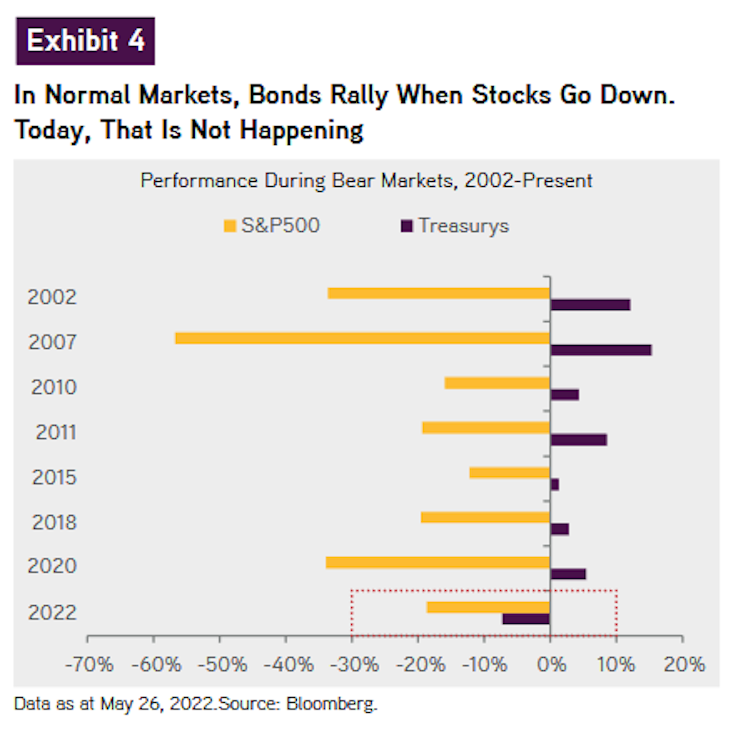
The age-old advice is to buy bonds to hedge against stocks going down. Well, its seems that this market is quite unique in the fact that bonds and stocks have gone down together. While bonds have still "outperformed" stocks it's been an ugly year for both.
2.) Stagflation Winners?
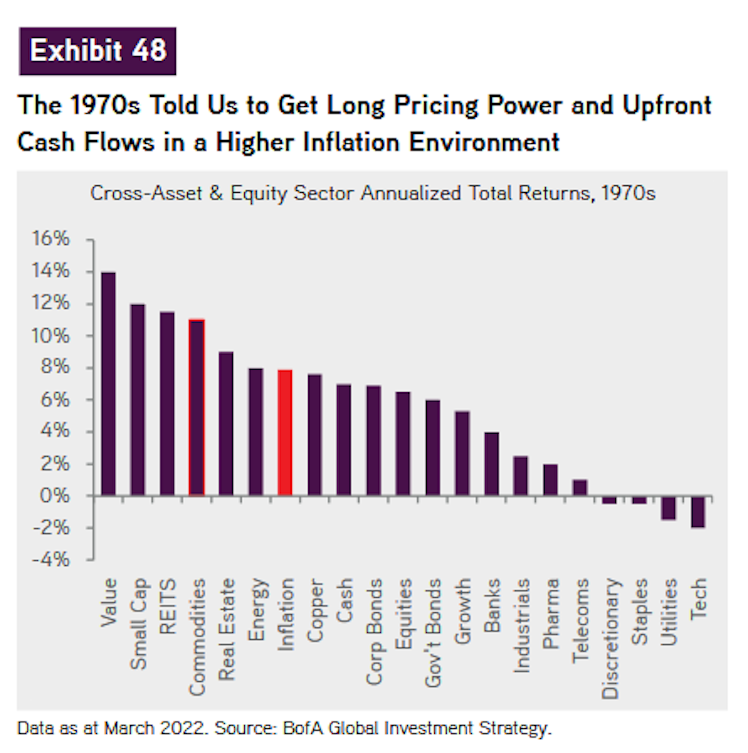
KKR believes it might be time to revisit the 1970s Stagflation playbook. Given the fact Real Bond Yields are negative, this could mean the companies with the strongest pricing power as well as the companies with the highest cash flows will be the winners in this environment.
3.) A Good Entry Point?
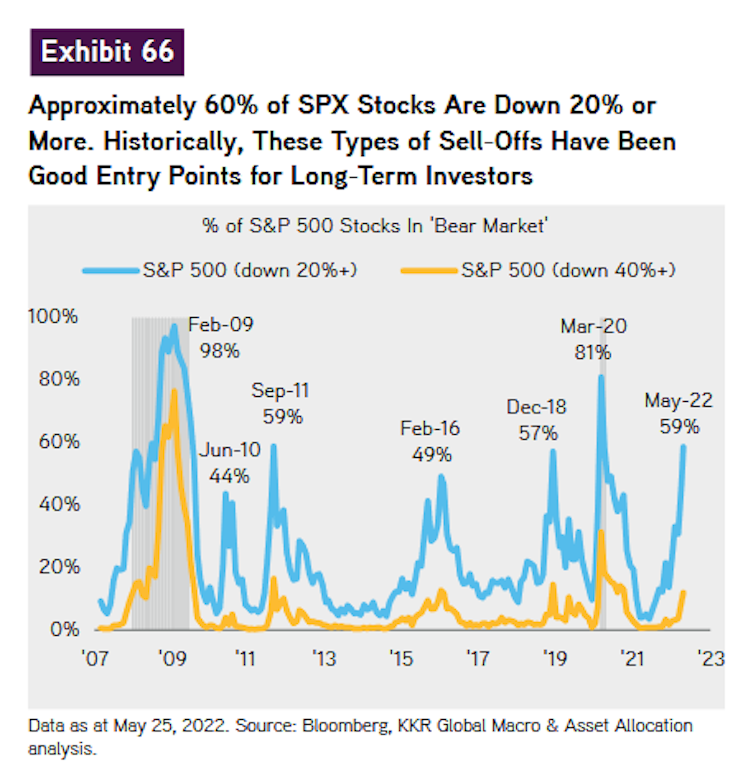
60% of S & P 500 stocks are down 20% or more, this has traditionally been a pretty good time to buy.
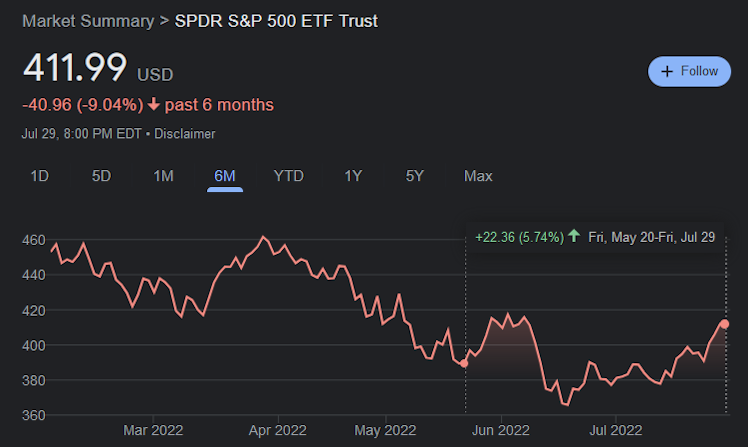
If you bought SPY on May 20th when the report came out you would be up 5.7%. KKR seems to be right, at least in the short term.
In total there are over 100 graphs that KKR uses to explain their position that investors are in for more pain in the short term. They expect the broader market slowdown to continue and companies to engage in more spinoffs, acquisitions, and debt issuance than normal. This could give investors that lean into the volatility of the market to do better as this is unlike any market many investors have seen.

Finally, a quote that KKR opens their Update with. Investors have just got to stay in the game, no time to give up now.
Already have an account?