Trending Assets
Top investors this month
Trending Assets
Top investors this month
Fear and Greed Index crosses into 'Extreme Fear'
Today, the Fear & Greed index closed down 10 points, the first time we've been in the 'Extreme Fear' category since October 2022:
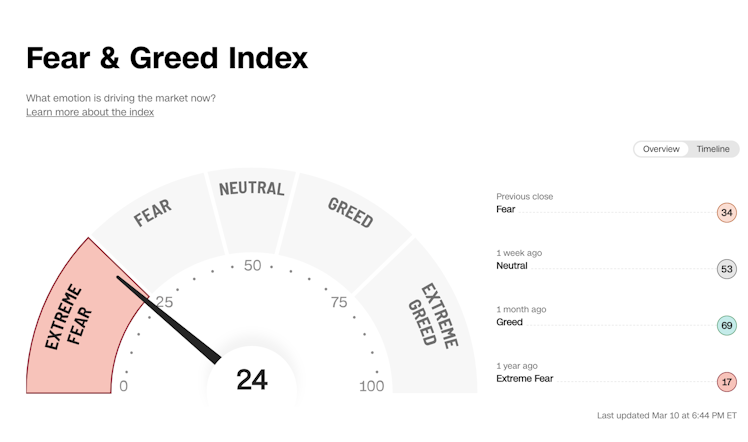
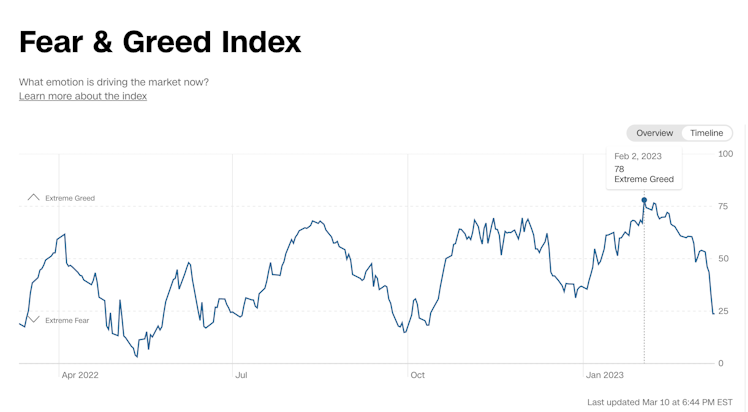
About a month ago, on Feb. 2nd, we were all the way up at 78, in the Extreme greed range. It's crazy how fast things can change. But if you look at the last year, we've actually done an up-down cycle like this five times:
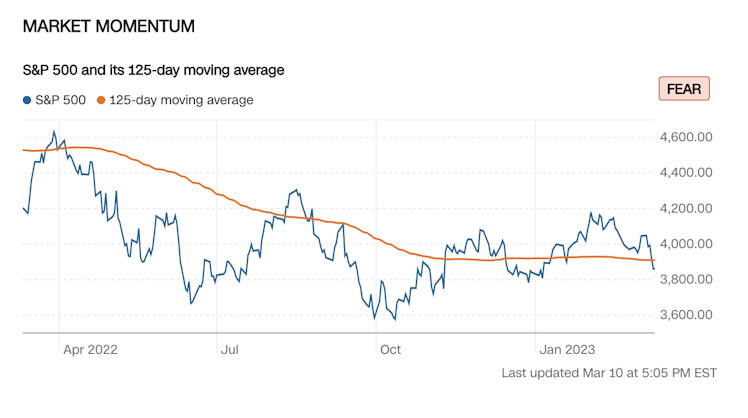
The Fear & Greed index is based off of 7 indicators. The first is Market Momentum: Is the S&P 500 above or below its 125-day moving average( and by how much)? We just crossed below it:
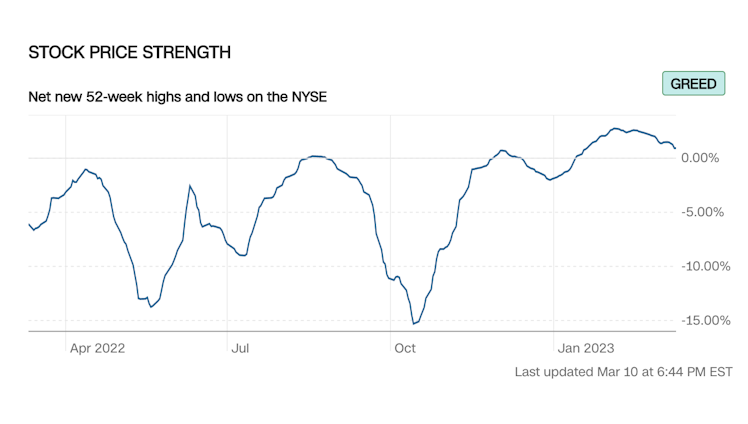
The second indicator is Stock Price Strength, which is still in the Greed. There are currently more stocks on the NYSE at 52-week highs compared to those at 52-week lows:
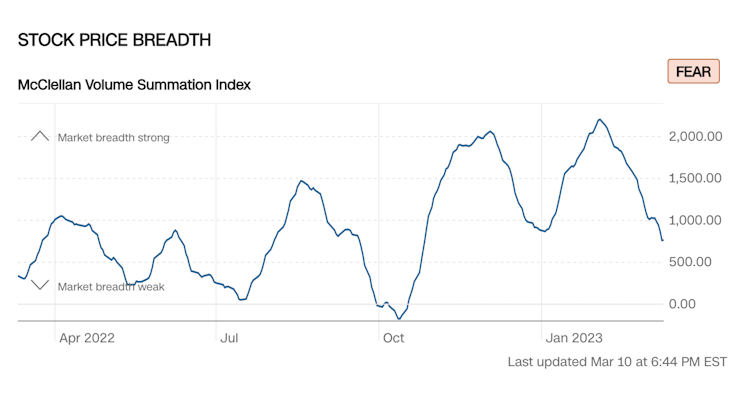
But its all fear from here. The third indicator is Stock Price Breadth. The amount, or volume, of shares on the NYSE that are rising compared to the number of shares that are falling. A lower number is bearish.
The put and call ratio is climbing fast (puts are the option to sell while calls are the option to buy. When the ratio of puts to calls is rising, it is usually a sign investors are growing more nervous)
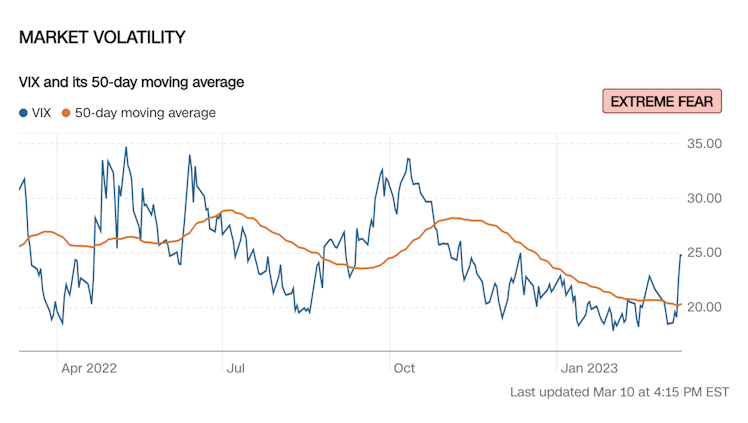
The VIX has spiked:
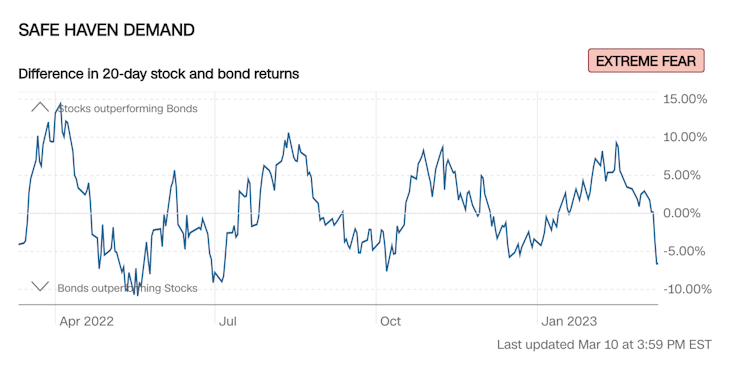
Bonds have outperformed stocks over the last 20 days:
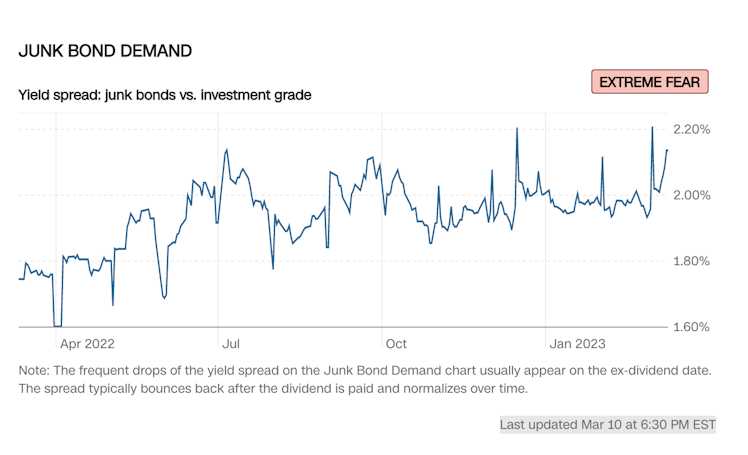
A wider spread between junk bonds vs. investment grade bonds shows more caution.
Excessive fear tends to drive down share prices.
Hello darkness, my old friend.
Already have an account?