Trending Assets
Top investors this month
Trending Assets
Top investors this month
$11.6MFollowers
Chart of the Day - moving on up
For those who grew up in the 80s, they will remember the TV show "The Jeffersons". The theme song was called "Movin' On Up" and this song became a meme for whenever someone had good things happening to them. We would say they were movin' on up like George Jefferson
I thought of this yesterday as we moved my son into an apartment. It is a brand new building in a redeveloped urban neighborhood full of young professionals. It looks like it will be a great place to live
I also thought of this when Reem Azhari, PhD shared a picture of the S&P 500 over time that hung in the room of her son, and my former student, Adam. Adam was taken from us too soon, but he left an indelible mark on all who met or interacted with him
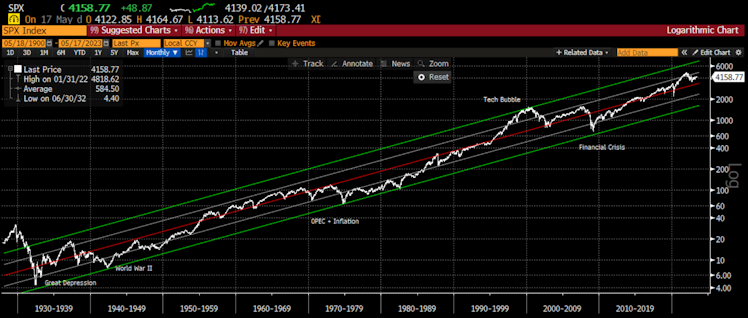
Adam looked at the picture of the long-term (100 years) S&P 500 with different market or world events on it. I have tried to recreate that here by looking at the logarithmic chart since the late 1920's
I have added the regression + 1&2 standard deviations to show you when the index has moved to an extreme on the upside or downside. Finally I have labelled certain key events
The first thing we see is that this chart is movin on up like George Jefferson over the long term. This is why asset allocators and financial advisors favor a heavy allocation to equities for those with a long time horizon
The second thing you see is that major events do cause the market to move to extreme lows. We can see the Great Depression and World War II taking us down 2 standard deviations. We didn't get this oversold again until the OPEC-led inflation of the 70s. We got there again during the Financial crisis
Other events like the debt ceiling dramas or Covid barely register as a blip on this long-term view. Nor does the 2022 sell-off. We do see that the most overbought we ever got was the late 1920s and then the tech bubble in 2000. We didn't get there in 2021 even
One can also notice that if you enter into the market when it is 1 s.d. cheap or more, you can earn great returns. However, if you enter in when it is 1 s.d. expensive, it can take many years to break even again.
We got to these levels in the late 1930s and in 2007. It took 5-10 years to breakeven. We also got there in 2021. If you entered the market at that time, will it take 5 years or more to breakeven?
Stepping back and looking at the big picture can give us all perspective on how we should be thinking about things and approaching life. This is what parents try to impart to their children. I am glad Reem shared that picture with me to remind me of this
Stay Vigilant
#markets #investing #stocks #longterminvesting #stayvigilant
Already have an account?