Trending Assets
Top investors this month
Trending Assets
Top investors this month
$11.6MFollowers
Chart of the Day - what are we rooting for?
It was a perfect Fall weekend in Chicago, with bright sunny days & cool nights perfect for a fire. It was mornings filled with golf & afternoons with football. After a terrific win for my beloved Illini, I got together with college friends & the enthusiasm & expectations were quite high. I am trying to stay balanced & I am just rooting for a bowl game. On the flipside, the Chicago Bears came back to reality on Sunday. Emotions were similarly strong, but negative, on the outcome. However, I am also trying to stay balanced & getting a good draft pick probably serves the team better than a win. It was a weekend where I had to keep trying to remind myself - what are we really rooting for?
Today we will get the latest reading on ISM, my preferred measure of growth in the economy. We will get others this week too, with durable goods & non-farm payrolls. We will have a good idea of the direction of growth in the economy by the end of the week. Good numbers keeps the Fed solidly in play, as it will have no excuse not to tackle inflation. Weak numbers will point to the next show to drop - earnings - & give the bears another reason to press the move lower. So one must ask - what are we rooting for?
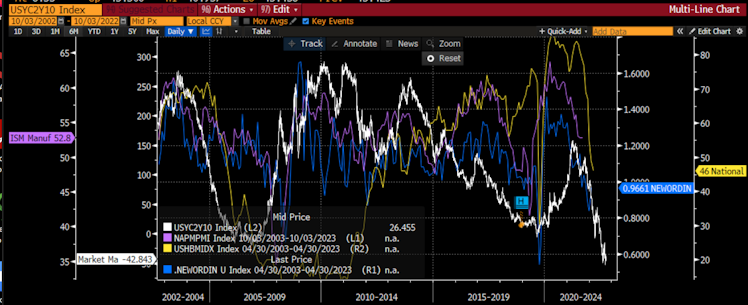
The expectation has been that growth would slow pretty considerably by now. Some thought, and still do, that growth will slow enough to pull down inflation. Not yet. However, I look at three measures that lead the ISM & all give us a sense that growth will fall below the 50 threshold of expansion/contraction & maybe even below the 47 threshold of recession.
The first is the yield curve, leading by a year. It is sending a particularly bearish message on growth and has been in freefall since the summer. It is in white. The second is the housing market index in yellow leading by 6 monhts. It is also in freefall but from much higher levels. We can also see that it is prone to wild swings in either direction as it foretold of a very weak economy in 2010-2013 that never really materialized. However, housing does lead the economy into and out of a recessions so we must pay attention.
The third measure, also leading by 6 months, is the ratio of new orders to inventories. The inventory build has been an ongoing theme all summer and Nike just brought it up again. Ironically, this measure n blue, ticked higher last month. We shall see how much was anticipatory inventory build ahead of potential strikes vs. goods that can't be sold at any price.
The forecasts for growth do not look really healthy. Consensus only sees ISM falling from 52.8 to 52 so not nearly as bleak. These other measures tell us there is more risk. However, is good news good or is good news bad? Is bad news good on the Fed front? What are we rooting for? Understanding this can help us keep our emotions in check after a good win or an ugly setback.
For what it is worth, being out and about this weekend, there are zero signs of a recession in my part of the country.
Stay Vigilant
Already have an account?