Trending Assets
Top investors this month
Trending Assets
Top investors this month
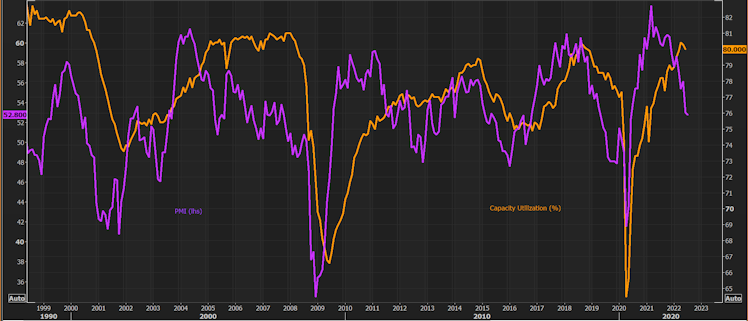
Capacity Utilization and ISM
The chart below depicts capacity utilization (CU) against the ISM. The two have more or less moved in lockstep over the years. The reason this is important is because as ISM has started to fall (leading indicator) so should CU if the historic correlation holds true. This is both good, and bad. The good side of falling CU is it is a sign of demand destruction which means usually a lower demand for goods, which means the price level will fall to find a new equilibrium between quantity supplied and what is being demanded by the market. The second part is that this means that there will start to be a rise in unemployment that is obviously bad. As lower demand means less need for workers. This very simply is because the machines are fixed resources, and what that is to say is whether you produce 1 unit or 100 units you still need that equipment to produce any quantity of units. Employees are variable resources so as the quantity of units that needs to be produced changes so will the amount of workers you need to help try to produce the final output. You could say that it is because there will be changes in the production function, and let us say in the sense that the output needed relative to inputs will change, as the demand for goods and services changes. So we can see that is bad, however it is bad if it persists. The most positive part though again assuming the correlation holds is that we should see a decrease in prices.
Already have an account?