Trending Assets
Top investors this month
Trending Assets
Top investors this month
$11.6MFollowers
Chart of the Day - money
"I don't know what they want from me
It's like the more money we come across
The more problems we see" => Notorious B.I.G.
On Friday I brought up the GDP = C+I+G+(X-M) equation. Today I want to look at the MV = PY equation, also known as the Quantity Theory of Money. Money Supply Velocity = Price of goods Amount of goods.
It was actually discovered by Nicolaus Copernicus in the 1500s but was really made popular by Anna and Milton Friedman in the 1960s as monetarism was becoming popular.
The idea is pretty simple at its core: the price of goods and services is directly linked to the money supply. However, one part is often over looked and that is velocity or the propensity to spend/invest money.
Austan Goolsbee reminded the CFA Society Chicago annual dinner audience of this in the Fall of 2022. Then velocity came back big time in 2021 and inflation shot up.
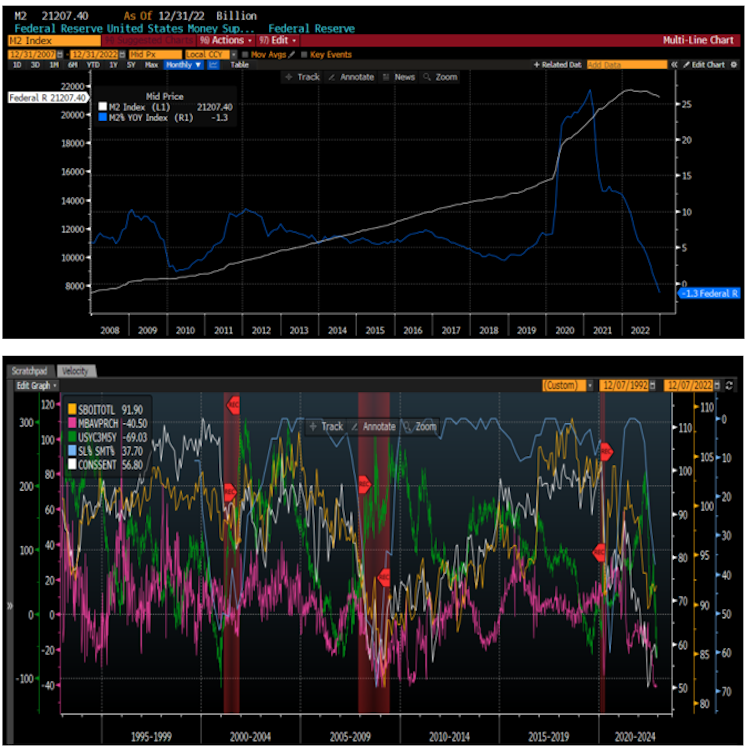
What is it telling us now? The top chart shows us the level of M2 money supply as well as the YOY change. The change is what most focus on but the change just want negative for the first time in the 60 years of data I can see.
However, the level of M2 in the system is still near an all-time high. This leads to the stock vs. flow argument many economists are having. What matters more - the historic drop or the historic level?
As I have learned in the markets we live at the margin, I am focused on the drop and what that means. Optimistically, it means that the price of goods and services will also drop as the amount of goods stays the same given the historic level.
However, then we turn to the bottom chart, we approximate velocity. We can measure it but it is backed out of an equation and with a terrific lag. For our purposes, it is better to try and gauge what it might look like.
What do we use? Small Biz Optimisim, Consumer Sentiment, Banker willingness to make loans, MBA refinance activity, the yield curve. Each of these gives us a clue what various players feel about the desire to borrow or lend money.
You can see in the bottom chart that each of these measures is collapsing. There is varying degrees of volatility but all tend to collapse together when we are near a recession.
Money supply is shrinking. Our best guess of velocity is falling. Sure, perhaps this means price levels are coming lower, which we have seen for food, energy and shelter.
However, it also means the amount of goods and services is going to be coming lower as well. In fact, that was obvious in the Fall as consumers spent more money on goods but the number of goods was down. Prices were higher so people spent a bit more but got less.
So looking at another equation of what could happen still gives us a bit of a downbeat message. I don't fancy myself any sort of permabear, I just report what I see. I am happy to be convinced otherwise.
If you can't convince me, I suggest you ...
Stay Vigilant
#markets #investing #economy #recession #stocks #bonds
Already have an account?