Trending Assets
Top investors this month
Trending Assets
Top investors this month
Data-dive: Stock Rally Is Broad-based $SPY
January 2023 is starting off strong, with large buying in equities across the board. When breadth is strong, momentum can lift markets higher.
Let's look at a few charts pointing to big inflows in stocks. Let data show the way!
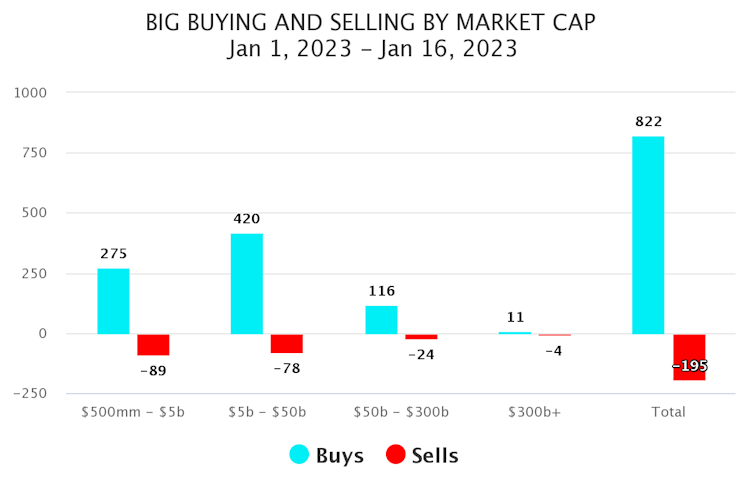
YTD buying by market cap
We measure the number of stocks powering higher and lower on big relative volumes. This helps us see the overall flow of money. In 2023, there've been 3 times as many buy signals vs sell.
Also, small-caps, mid-caps, and large-caps all show that same pattern:
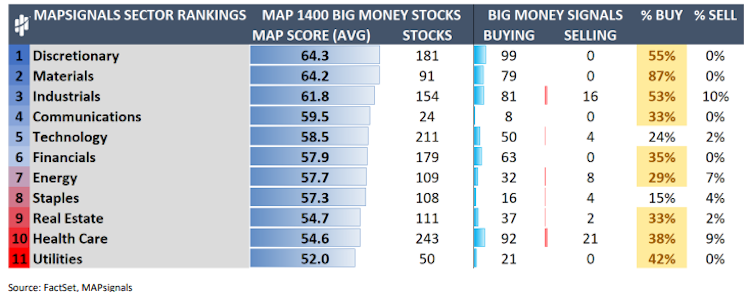
Sector Buying Last Week
Now that we know the overall trend, let's zero down into sectors. Below are last week's total buys and sells by the 11 major sectors.
It's a lot going on in this graphic but look off to the right at the yellow shaded areas. If a sector is shaded, it indicates that over 25% of it's universe was bought. You'll notice that 9 sectors were under heavy accumulation. The only areas not seeing significant buying was Technology $XLK and Staples $XLP:
Finally, this all lends well to our Big Money Index. It's starting to power higher as buyers are clearly in control. We are nowhere near overbought conditions.
I've circled prior upside pivots in the BMI. The market tends to have further to climb once it begins ramping like now:
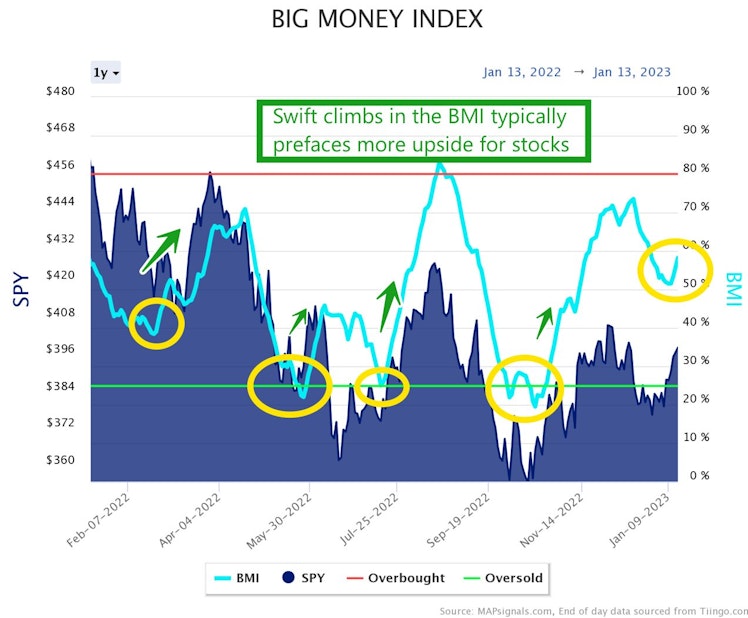
Respect the trend. There are many positives showing up under the surface of the market.
Learn more about how MAPsignals data can inform your investing. MAP the market! https://mapsignals.com/get-map/
MAPsignals
Put the Power of MAP in Your Portfolio - MAPsignals
Put MAP Power in your portfolio! Sign up a MAPsignals subscription today.
Already have an account?