Trending Assets
Top investors this month
Trending Assets
Top investors this month
TA Opinion: Fibonacci Natural Order of Things or Fooled by Randomness ?
To the relief of most investors, we had a strong move up today. The narrative being reported by the media is the bulls were cheering the cooling wage growth figures that were reported.
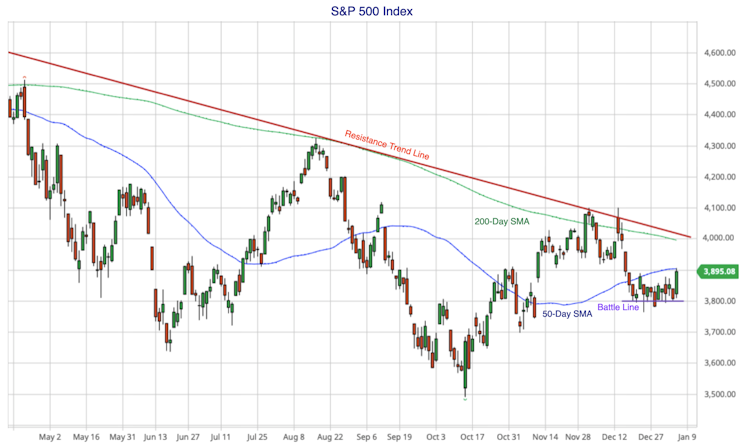
Over the last few weeks, battle lines between the bulls and the bears seemed to be drawn near the 3,800 level. This seemed to be where a short-term defensive stand was being made. Every time the market approached or breached this level, we'd bounce off it with renewed buying interest.

Whenever I see this happening, I look for an identifiable line of support in the chart. There will be a psychological effect whenever we approach round numbers divisible by a hundred, but this seemed to be a stubborn defensive line that was being formed. There didn't seem to be any obvious line of support to me, either horizontal, angular or moving average. This is when I resort to looking at Fibonacci levels. Now, I'm not a "world has a natural numerical order" type of person, so I've always approached Fibonacci with a very healthy dose of skepticism. However, time and time again I've seen the market respect Fibonacci levels for both market indices and individual stocks.
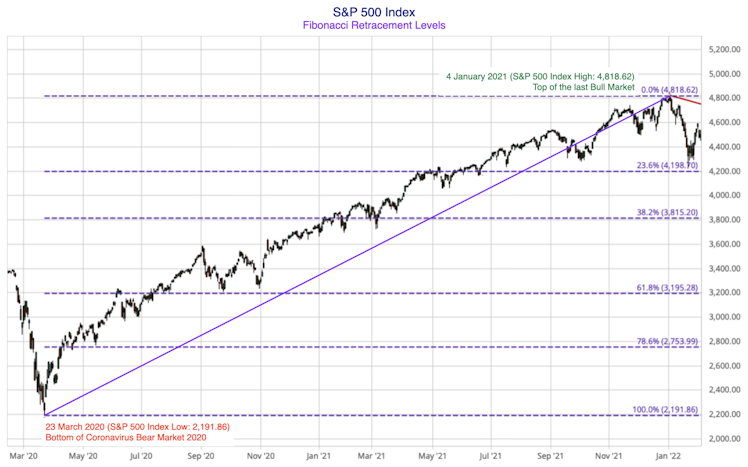
I draw Fibonacci retracement levels by identifying the most significant high and the previous significant low for a market index or stock. Our most recent bull market in the S&P 500 index topped at 4,818.62 back in the 4th January 2022 (a lifetime ago it seems). The bottom of the bear market preceding that all time high was 2,191.86 back in 23rd March 2020. This was the bottom of our very brief Coronavirus Bear Market before the market turned and marched relentlessly higher to make a succession of all time highs. I've marked up the Fibonacci retracement levels using these two key levels:

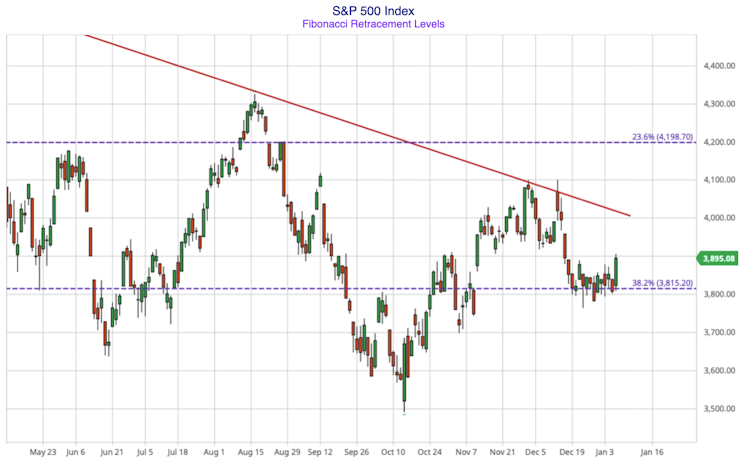
If we fast forward to now, we see battle line congestion was formed right by the 38.2% retracement level at 3,815.20:

Spooky !
It's hard to think that the breeding habits of rabbits and the golden ratio observed in so many examples in nature could have some instinctive, psychological influence on the investment markets. I accept that it's easy to be "fooled by randomness", but as I've said, I've seen Fibonacci levels respected too often to dismiss it outright. Maybe there's enough "big money" institutional traders making buy and sell decisions on Fibonacci levels that it becomes a self-fulfilling prophecy?
Whatever the explanation, when I see battle line congestion with no obvious line of support or resistance, I'll take a glance at the Fibonacci levels. As a long-term investor, Fibonacci levels won't trigger any call to action, they just set the expectation that the market can pause there for a while before it makes another leg up or down. If anything, it tells me to be patient and wait to see which direction the market will move before I press the buy button on anything. I always prefer to move in the same direction of the market.
Great post, very well written.
Thanks for sharing! Fibonacci levels are widely used so I would not surprised if it is the explanation for this battle line however, there are so many indicators in TA that it’s easy to be “fooled by randomness”.
Already have an account?